This analysis evaluates Agoda’s sustainable travel badges on hotel listings, emphasizing the platform’s leadership in promoting environmentally conscious hospitality practices by May 2025. It details Agoda’s GSTC-aligned training initiatives since 2022, its USAID partnership expanding to five Asian nations by 2024, and the forthcoming digital Sustainable Tourism Academy. The badges, awarded based on criteria such as water conservation, energy efficiency, waste reduction, nature protection, and community support, have contributed to a 25–40% booking increase for certified properties. With a rigorous certification process ensuring over 95% badge accuracy and user-friendly tools like sustainability filters, this study highlights how Agoda facilitates low-impact travel choices, aligning with the global tourism sector’s 8–9% carbon emissions challenge and fostering a more sustainable future for travelers and hotels alike.
Steps to filter for sustainable resorts on online travel sites
This study outlines actionable steps to filter for sustainable resorts on online travel sites, addressing the environmental impact of tourism, which accounts for 8% of global carbon emissions It highlights platforms like Booking.com’s "Travel Sustainable" filter, Agoda’s Southeast Asia-focused sustainability efforts, and EcoHotels.com’s GSTC-exclusive listings, which plant a tree per booking. The guide emphasizes certifications like EarthCheck (auditing 1,300+ properties) and Green Key, focusing on energy, waste, and community support, while cautioning against greenwashing through verification methods like GSTC.org and B Corp Directory checks. By choosing resorts with transparent practices, travelers can reduce their footprint, support local economies, and contribute to a more sustainable future amidst rising climate challenges.
Online travel agencies with carbon offset options for flights
Aviation contributed 2.5% of the world's CO2 emissions. This analysis looks at online travel agencies (OTAs) that offer carbon offset options for flights. Highlighting websites like Expedia, Travelocity, and Trip.com, it describes their collaborations with suppliers like TerraPass, which supports methane capture (23%), renewable energy (35%), and forest conservation (42%), and Cool Effect, which donates 90% of $18.68/tonne to 14 projects. Calculations of flight emissions—0.55 tonnes for short-haul flights and 3.75 tonnes for long-haul flights—as well as the effects of offsets, which help 47 indigenous groups and prevent 18 million tonnes of CO2e annually, are described in the study. This guide encourages travelers to adopt sustainable practices, in line with the International Civil Aviation Organization's net-zero goal by 2050, and is verified by third parties (such as Gold Standard) to ensure transparency.
How to book verified carbon-neutral tours through online agents
This study outlines a detailed guide to booking verified carbon-neutral tours through online travel agents, addressing the environmental impact of tourism, which accounts for 8% of global carbon emissions. Amid a 70% increase in sustainable travel searches, it highlights platforms like Staze, MyClimate, and ByWay, which facilitate low-carbon travel through train-based itineraries and verified offset projects. The guide details steps to calculate trip emissions, filter for GSTC-certified tours, and select accommodations with LEED certifications, while showcasing examples like Kuoda Travel’s Amazon tours supporting reforestation. By emphasizing third-party verifications (e.g., Gold Standard) and slow travel alternatives, this analysis empowers travelers to make informed, low-impact choices, aligning with future trends like sustainable aviation fuel adoption by 2030.
Online travel agent platforms supporting local conservation projects
This study examines the role of online travel agent (OTA) platforms in supporting local conservation projects, emphasizing sustainable tourism’s impact as of May 2025. It details efforts by Intrepid Travel, achieving a 56% per-person CO2 reduction since 2019, and G Adventures, which reinvests 78% of trip spending locally via its Ripple Score. Gondwana Eco Tours donates $287K yearly to NGOs, while Follow Alice sustains Tanzanian communities with 70% local trip fees. With tourism responsible for 8% of global CO2 emissions and 8 million metric tons of plastic entering oceans annually, these OTAs mitigate environmental harm through carbon neutrality, reforestation, and local empowerment. This analysis provides travelers with a framework to select platforms that prioritize conservation, balancing economic benefits with environmental stewardship.
How to find low-impact certified hotels using Booking.com filters
This analysis examines the process of finding eco-certified hotels using Booking.com’s updated filters, reflecting the platform’s commitment to sustainable travel as of May 2025. Since March 2024, Booking.com has required third-party certifications through partnerships with Sustonica, Green Key Global, and EarthCheck, ensuring properties meet standards in waste reduction, energy conservation, water efficiency, nature protection, and community support. With 53% of travelers influenced by climate change news and 8% of global CO2 emissions linked to tourism, the study outlines a step-by-step guide to the “Travel Sustainable” filter, verification methods via the because.eco API, and the platform’s efforts to support smaller properties with funding. This exploration empowers travelers to confidently select certified stays, fostering a more responsible tourism industry.
Guide to choosing low-impact travel experiences on travel booking sites
Given that tourism accounts for 8% of global greenhouse gas emissions, this analysis examines a thorough guide to choosing low-impact travel experiences on online travel agencies. The report emphasizes websites like Booking.com and Airbnb that use filters and certifications (such as Green Key and LEED) to find low-impact travel, lodging, and activities in light of atmospheric CO2 levels above 400 parts per million and a 1.5°C warming predicted by 2024. It looks at ways to lessen carbon footprints, such as taking the train (6–10 times less CO2 than flying) and eating sustainably, while highlighting community support through websites like Fairbnb.coop. By 2030, this guide will have given tourists practical ways to reduce their impact on the environment and promote responsible travel.
Comparison of sustainable property options on major OTAs
This analysis compares sustainable property options on major online travel agencies (OTAs), including Booking.com, Expedia, and Skyscanner, as of May 2025, guiding travelers toward low-impact stays. It evaluates each platform’s offerings, such as carbon offset tools and nature-focused filters, alongside certifications like Green Key, adopted by over 3,900 properties, to ensure authenticity. With global tourism contributing 8–9% of emissions, the study discusses the importance of sustainable travel, noting 61% of travelers prefer environmentally conscious options per 2023 data. Insights into platform-specific incentives, such as Airbnb’s 12% commission cut for nature-oriented hosts, and future innovations like AI-powered sustainability scoring by VRBO, underscore a shift toward a more responsible travel industry. This examination empowers travelers with actionable strategies to support environmental stewardship.
Booking low-impact lodges via expedia for sustainable travel
This article examines the growing trend of booking low-impact lodges via Expedia for sustainable travel, focusing on how the platform’s features enhance sustainable decision-making. It highlights Expedia’s integration of carbon emission comparisons and third-party eco-certifications, enabling travelers to select lodges that align with sustainability goals. With over 1,700 environmentally-certified properties, the platform supports a shift toward responsible tourism, balancing environmental preservation with traveler convenience, and projecting a model for future travel ecosystems.
This exploration delves into the role of online travel agencies (OTAs) in facilitating bookings for plastic-free accommodations, a rising trend in sustainable tourism as of May 2025. It evaluates leading OTAs, including Expedia and Agoda, for their capacity to highlight hotels and lodges committed to minimizing plastic use through practices like biodegradable packaging and reusable amenities. With global tourism contributing 8–9% of greenhouse gas emissions, reducing plastic waste is a vital step toward sustainability. The analysis examines user-friendly features such as sustainability filters and carbon tracking tools, alongside certifications like EarthCheck, operating in 70+ countries, to ensure authenticity. By identifying top platforms and providing practical booking tips, this study empowers travelers to make low-impact choices while supporting a more sustainable hospitality industry.
How to offset your holiday emissions through OTA partnerships
This guide explores how online travel agency (OTA) partnerships enable travelers to offset holiday emissions, addressing the environmental impact of tourism, which accounts for 8–9% of global carbon emissions as of May 2025. It examines initiatives like Travalyst, involving Booking.com and Skyscanner, which standardize sustainability metrics, and Expedia’s UNESCO Sustainable Travel Pledge, boosting eco-hotel bookings by 25%. With 90% of tourists seeking sustainable options, OTAs provide tools like carbon calculators and eco-certified lodging filters to minimize footprints. The analysis highlights benefits, such as a 30–50% emissions reduction, and future innovations like AI-driven carbon budgeting, projecting a $8.4 billion carbon offset market by 2030. This study empowers travelers to make informed, low-impact choices through OTA collaborations.
Finding vegan-oriented hotels on digital booking platforms.
In discussions about food, the focus often lands squarely on prices. Consumers are naturally drawn to the allure of savings, with supermarkets advertising deals that make purchasing essentials seem easy and affordable.
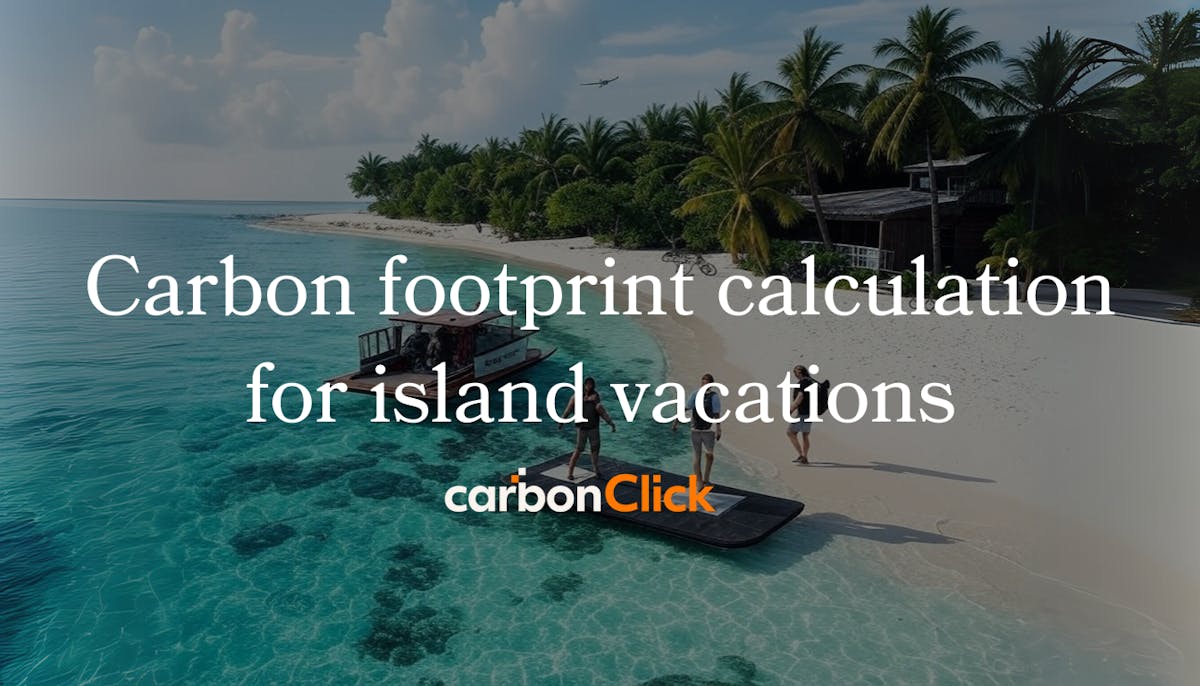
Tourism is responsible for around 8% of global emissions, with island getaways often having an even higher impact. Most of these emissions come from flights, places to stay, and getting around locally. Tracking them can help travellers make better-informed choices. Flights usually make up the biggest share of a trip’s emissions, but energy use in hotels and activities like tours also add up. The Paris Agreement recommends that individuals keep their yearly emissions below 2 tonnes. The way most holidays are planned today often pushes people over that limit.
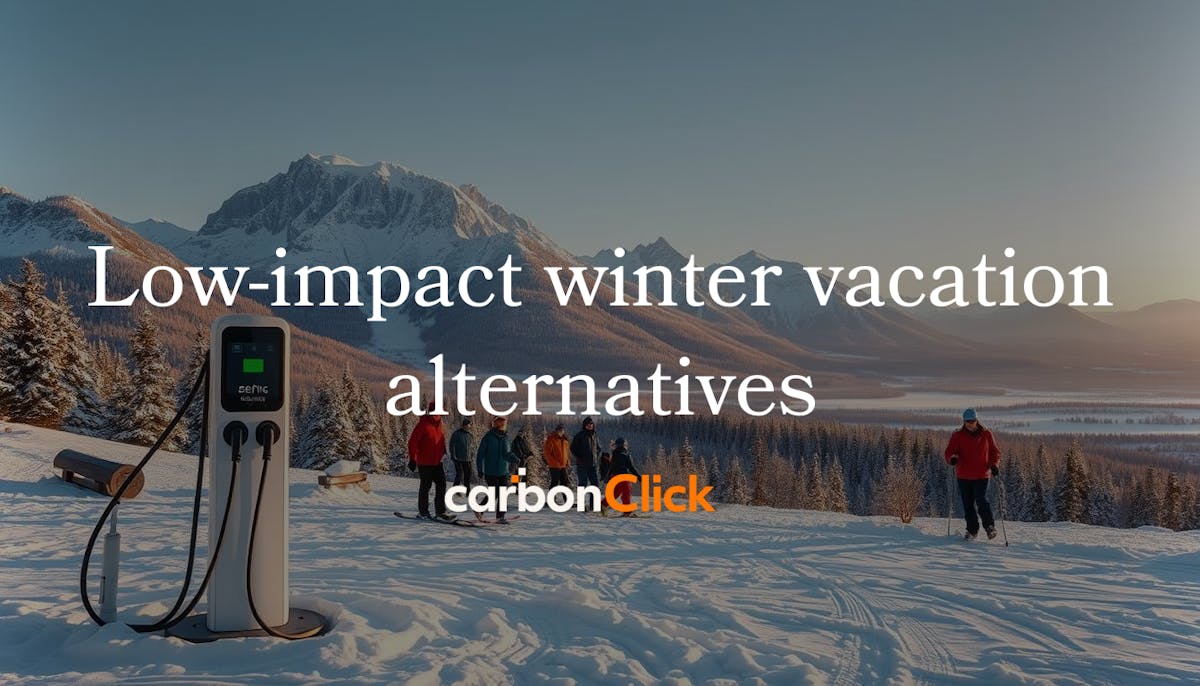
Exploring the United States during the colder months can be both enjoyable and considerate of the natural world. Thoughtful travel choices allow visitors to experience breathtaking winter scenery and engaging activities while limiting their impact on the environment. From the snow-covered landscapes of Michigan’s Upper Peninsula to picturesque small towns across the country, there are many destinations that prioritise sustainable accommodation and low-emission transport options. Travellers can fully embrace outdoor adventures—such as hiking, skiing, or wildlife watching—without compromising their commitment to more mindful tourism. With careful planning, it’s possible to create lasting memories while treading lightly on the places we cherish.
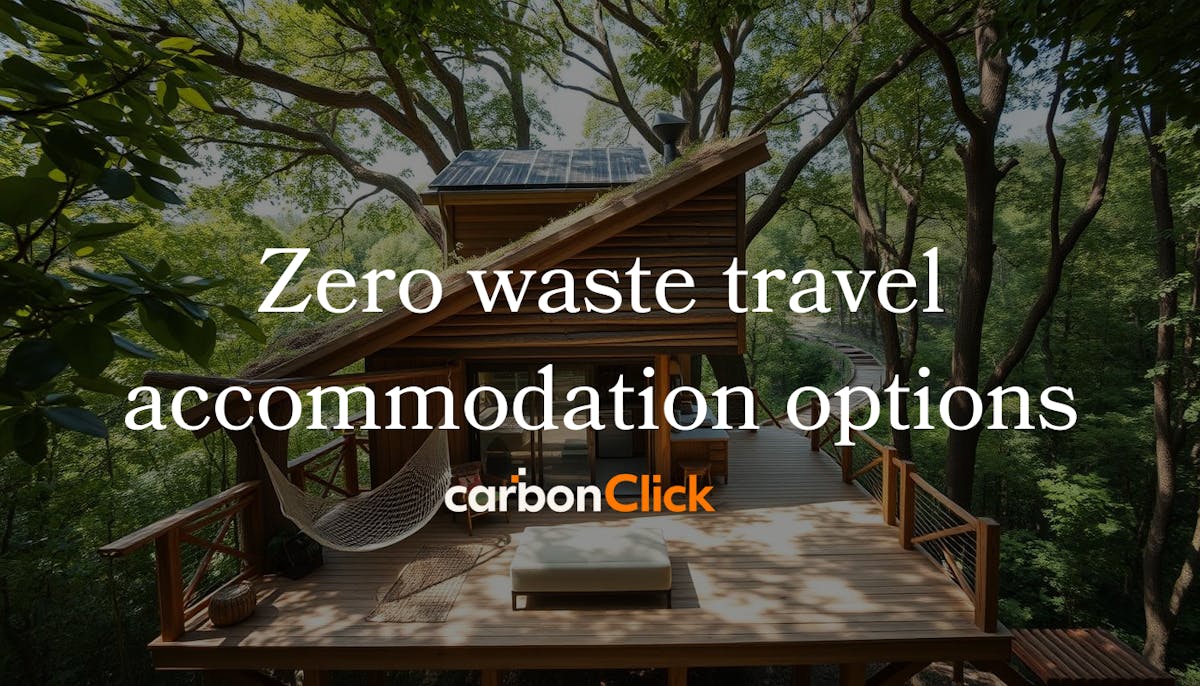
More travellers are now seeking sustainable accommodation options to reduce their environmental footprint. According to a Booking.com survey, 81% of respondents prefer lodging that prioritises sustainability. This shift reflects a growing awareness of tourism’s contribution to issues such as plastic pollution and carbon emissions.
Hotels and holiday rentals are responding by phasing out single-use plastics, introducing reusable amenities, and implementing energy-saving technologies. These initiatives enable guests to lessen their carbon footprint without compromising on comfort.
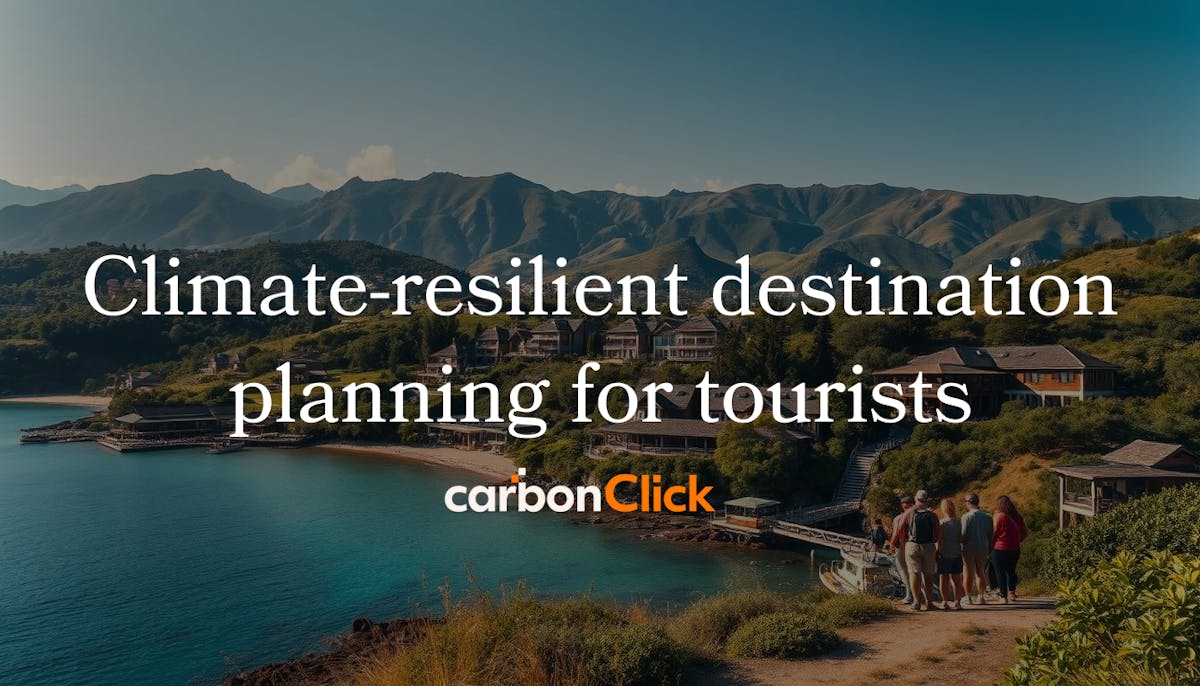
Climate-resilient destination planning for tourists
Coastal regions, renowned for attracting millions of global travellers, are increasingly vulnerable to the escalating impacts of climate change. Rising sea levels, pollution, and extreme weather events pose significant threats to vital ecosystems such as coral reefs and mangroves. As the tourism industry plays a key role in these regions, it must adapt to safeguard these natural assets while ensuring the stability of local economies.
The Asia Pacific region faces particular challenges in this regard. Despite its rich biodiversity, many destinations are grappling with significant sustainability gaps. During peak tourism seasons, marine pollution intensifies by up to 40%, severely affecting local ecosystems and the livelihoods of communities that depend on them. Enhancing resilience is crucial for the long-term viability of these destinations.
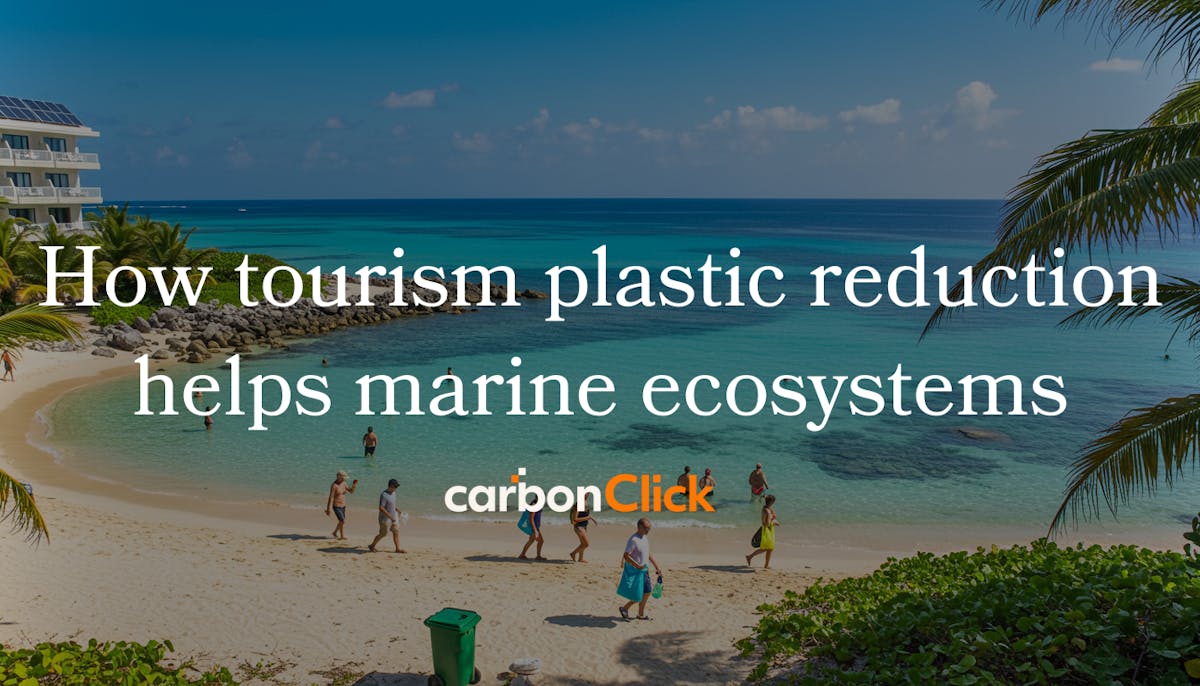
How tourism plastic reduction helps marine ecosystems
Millions of tonnes of waste enter the oceans every year, with coastal activities playing a major part. The travel industry is a significant contributor, with plastic pollution putting marine life and ecosystems at risk. Recent studies show that more than eight million tonnes of plastic reach the oceans annually, much of it linked to tourism. Cruise ships, beach resorts, and recreational activities are key sources of the problem.
Moving towards more sustainable practices is essential. Cutting down on single-use plastics and improving waste management are important steps. The aim is to protect the environment while encouraging responsible travel. Experts warn that, if left unchecked, plastic production could drive major emissions by 2040. Tackling the issue now will help preserve natural ecosystems for future generations. Small but meaningful changes within the industry can have a lasting impact.
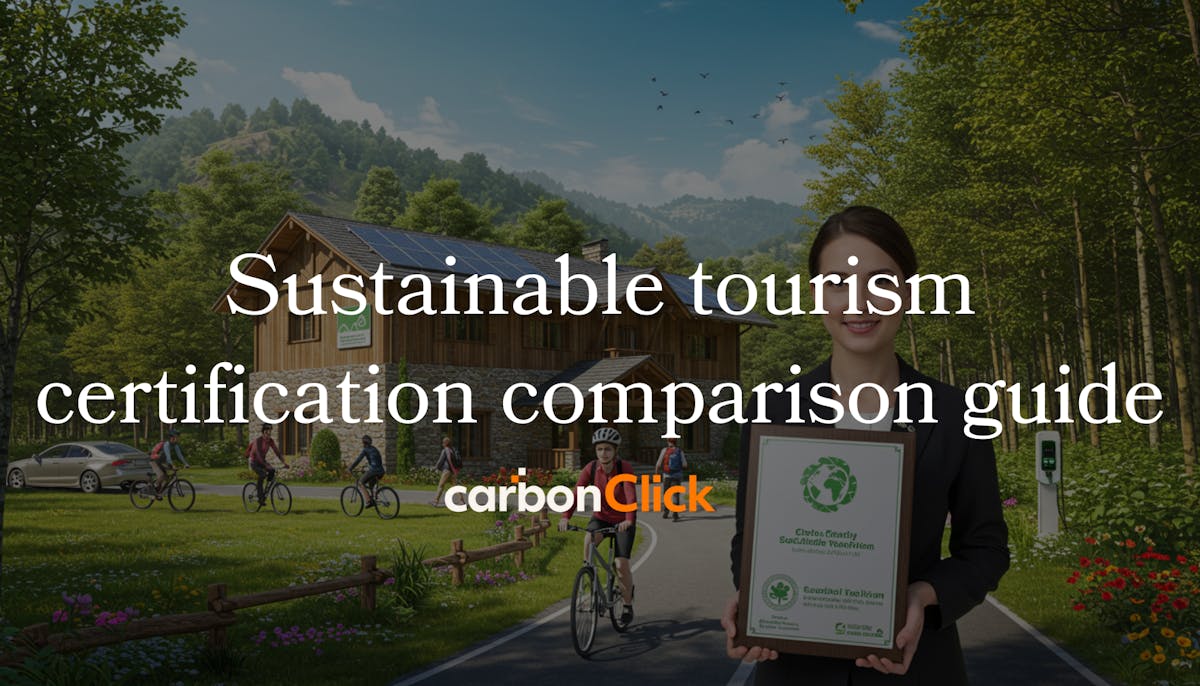
More travellers now favour businesses that follow recognised sustainability practices. According to a recent Virtuoso survey, 60% of tourists are willing to pay more for independently verified options that reflect genuine efforts. This growing demand is prompting companies to align with established frameworks. Independent certifications help distinguish meaningful actions from superficial claims. Travalyst’s 2024 compilation highlights 49 credible programmes that set clear and measurable standards for the sector. Meanwhile, new EU regulations—such as the Corporate Sustainability Reporting Directive (CSRD), coming into effect in 2025—will require greater transparency. This article explores six leading certification schemes, from Biosphere to Regenerative Travel, to support informed decisions by both businesses and travellers.
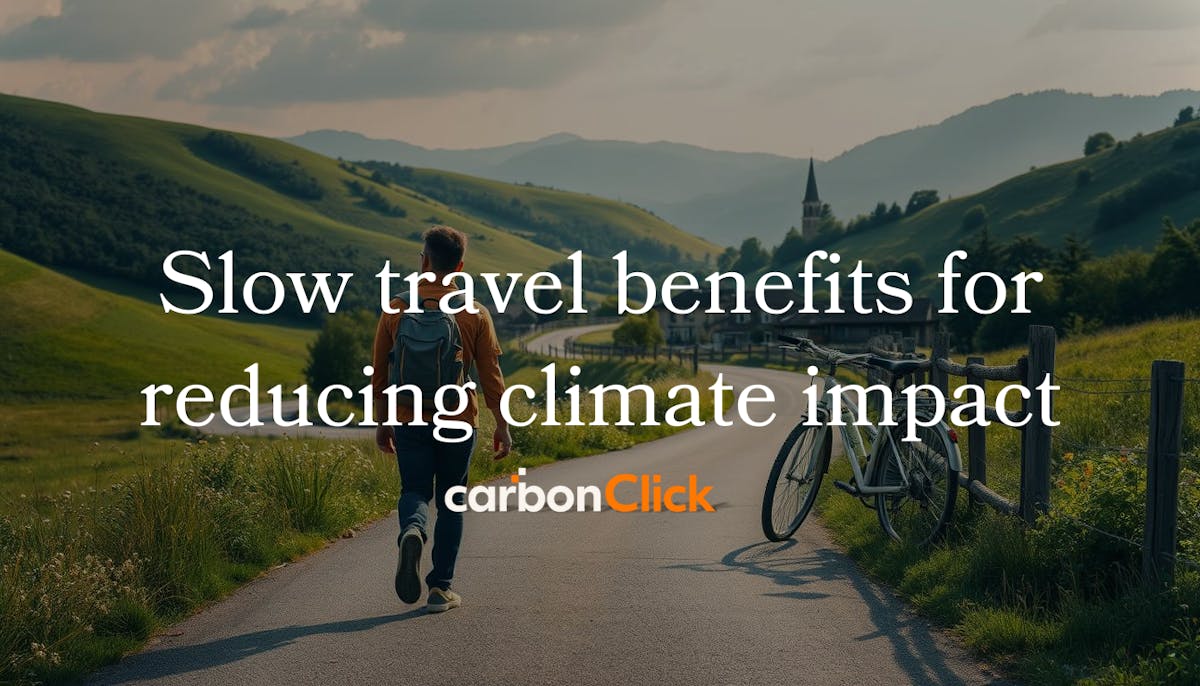
Traditional tourism often centres on quickly ticking off destinations, but this fast-paced approach can lead to higher carbon emissions and less meaningful experiences. Shifting towards deeper exploration offers a more rewarding alternative. Aviation accounts for around 2% of global carbon emissions, with passenger flights responsible for approximately 81% of that total. Opting for local travel or choosing longer stays can significantly reduce one’s impact. Recent trends show a growing number of travellers favouring domestic trips, motivated by both economic and environmental considerations.
Carbon offset programs for family vacation flights
Air travel is a major contributor to global emissions, with a single long-haul journey often producing more carbon dioxide than an entire year of driving. As a result, many travellers are now looking for practical ways to reduce the impact of their trips. Aviation is responsible for approximately 2–3% of global greenhouse gas emissions — a figure that rises to nearly 10% when considering emissions from all transport-related activities. This growing awareness has fuelled interest in meaningful efforts to lessen the environmental footprint of travel. Families planning their journeys are increasingly seeking straightforward, effective options.
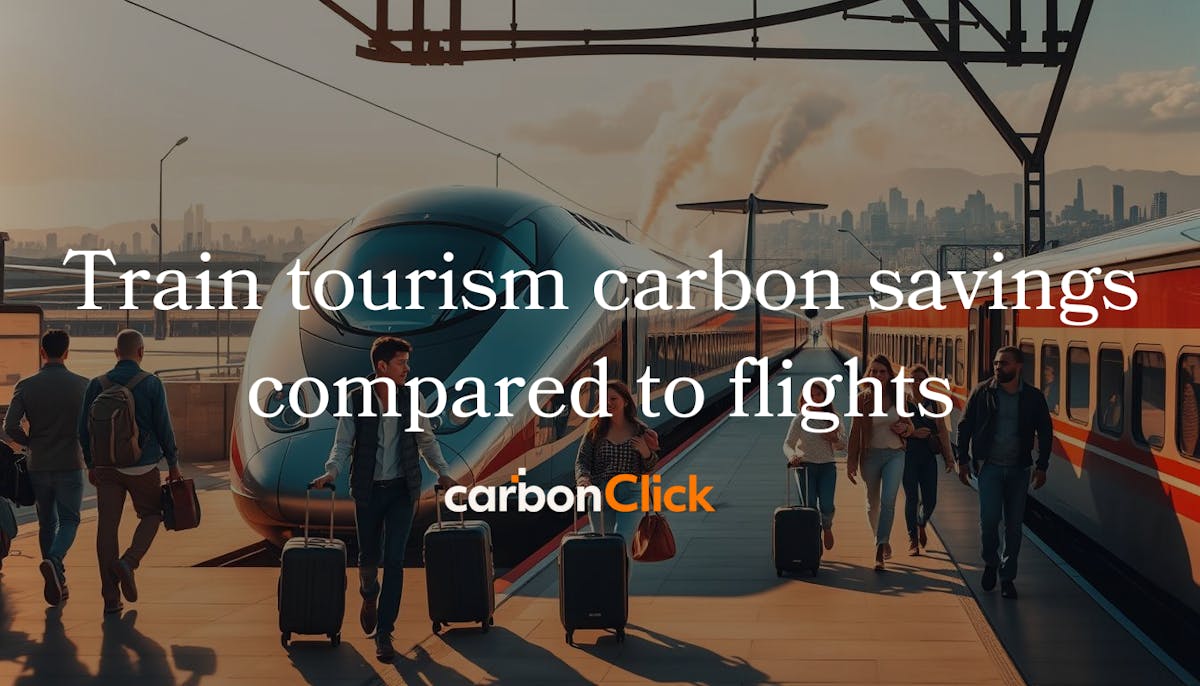
Air travel is a major contributor to global emissions, accounting for approximately 2–4% of worldwide CO₂ output. In addition to direct emissions, flights at high altitudes have further atmospheric effects that amplify their impact. For travellers seeking lower-impact options, alternative modes of transport can make a substantial difference.
Research shows that rail travel can reduce emissions by 73–91% on many popular routes. For instance, a Eurostar study found that a journey from London to Paris by train produces around 22kg of CO₂, compared with 244kg by plane. Similar patterns are seen across Europe, highlighting rail as a significantly cleaner choice.
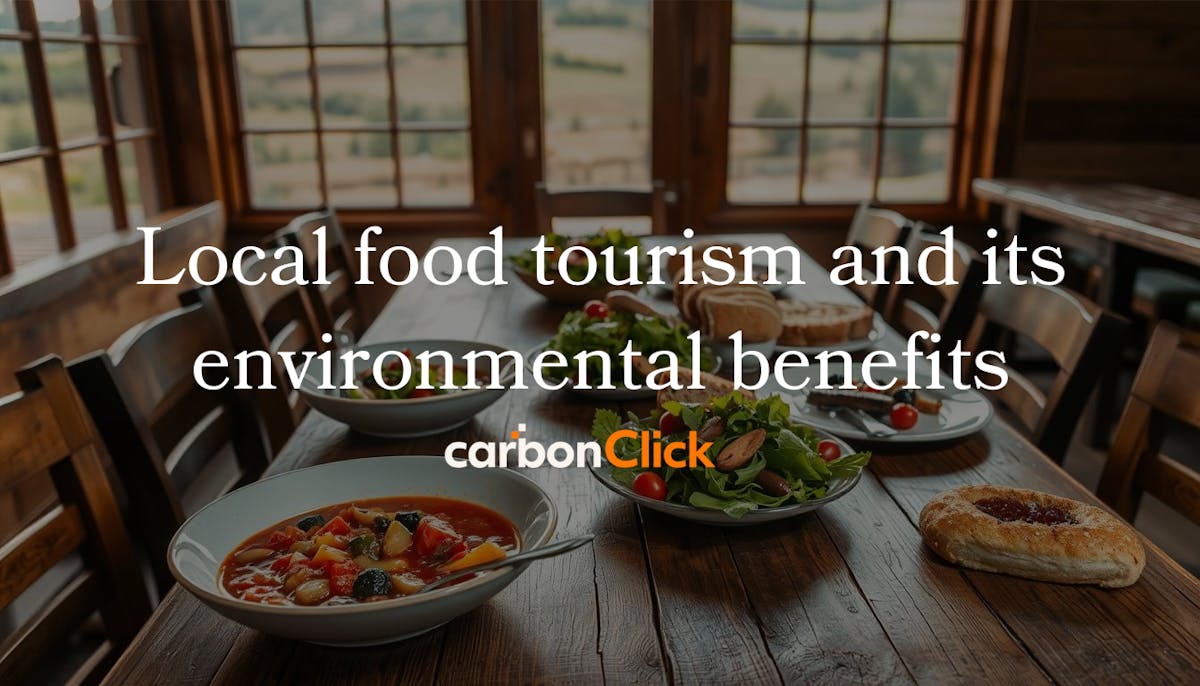
Global fast-food chains dominate the market, with more than 40,000 McDonald's outlets and around 45,000 Starbucks locations worldwide. This widespread expansion often eclipses traditional dining options, raising concerns about both cultural preservation and the strain placed on natural resources.
Farm-to-table restaurants present a meaningful alternative. Research indicates that they can reduce carbon emissions by up to 57% compared to large, meat-focused chains. By prioritising local sourcing, these establishments cut down on transportation and packaging waste while supporting nearby farmers and producers.
Regenerative tourism examples in small communities
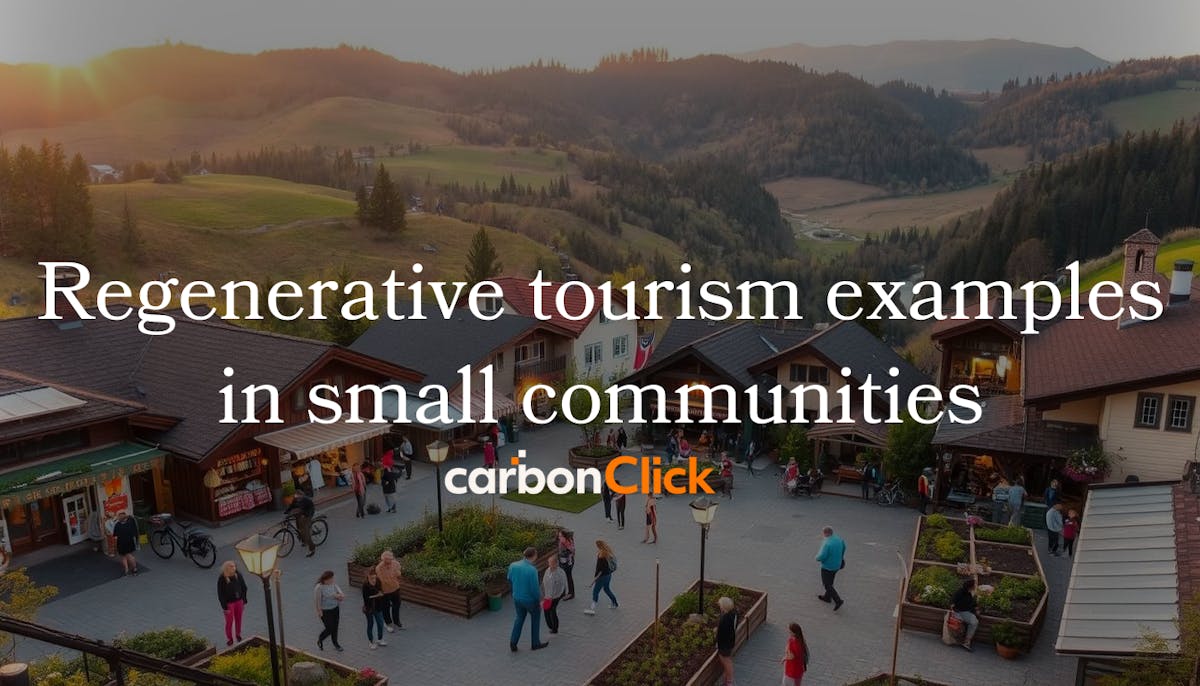
Travel is evolving beyond traditional ideas of sustainability, embracing a new approach that aims to leave destinations in a better state than before. This method empowers local communities while safeguarding natural resources.
Sonia Teruel brings over 20 years of expertise in this area, helping rural regions to grow through thoughtful visitor engagement. Her work fosters lasting benefits for both travellers and hosts alike.
Recent research highlights shifting traveller priorities: according to Booking.com’s 2024 report, more than 66% of travellers now seek experiences that actively enhance local communities. This growing trend offers opportunities for deeper, more meaningful connections.
Indigenous tourism practices for climate preservation
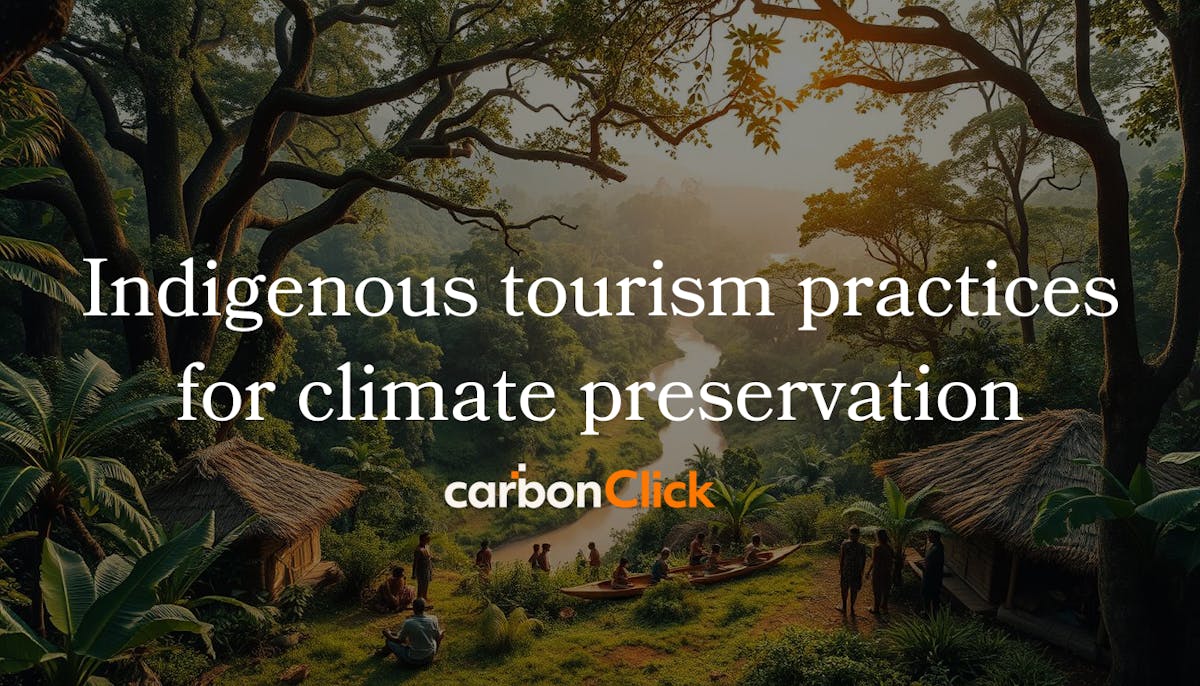
For centuries, local communities have protected vital ecosystems through time-honoured practices. These methods combine profound knowledge of the natural world with sustainable approaches to land use. Research indicates that territories managed by Indigenous groups contain around 80% of the world’s remaining biodiversity, often achieving better outcomes than government-led conservation initiatives, particularly in fragile regions.
Sustainable travel options: low-emission agents you can book through
Planning environmentally conscious trips has become increasingly accessible. Many companies now focus on reducing their environmental impact by managing emissions. In 2007, Natural Habitat Adventures pioneered the way as the first fully carbon-neutral organisation in this field.
These providers assess the emissions from both their trips and offices, investing in projects such as renewable energy or tree planting to offset them. Some even factor in flight emissions as part of their calculations.
Travel habits have evolved in recent years, with more people prioritising sustainability when planning their trips. A 2023 Booking.com report found that 76% of global travellers prefer accommodation options that minimise their environmental impact.
The pandemic prompted many to reconsider their travel choices, leading to a growing demand for responsible tourism. However, mainstream booking platforms often lack effective filters for identifying accommodation with sustainable practices.
Biodiversity-focused holiday itineraries for responsible travel
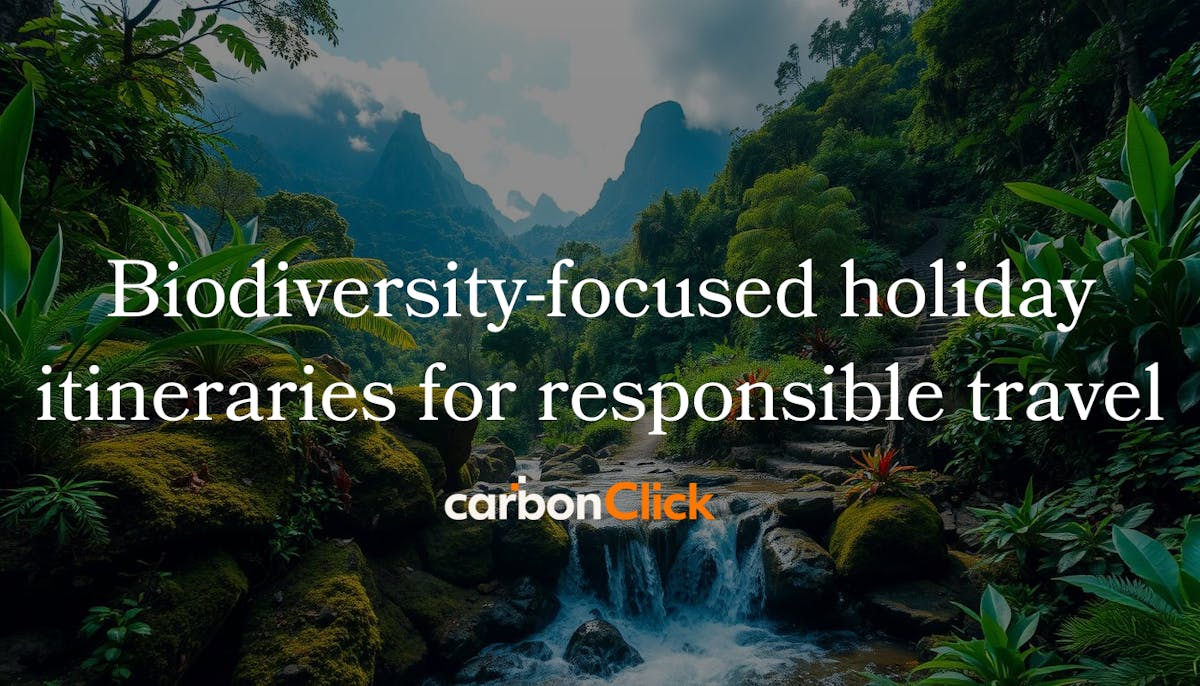
Travelers are increasingly seeking meaningful ways to explore nature while supporting conservation efforts. Nature-focused tourism emphasises the protection of ecosystems and wildlife, aiming to minimise environmental impact and promote sustainability. Recent studies indicate a 76% surge in demand for environmentally conscious trips. Destinations such as Costa Rica, the Galápagos Islands, and African reserves are at the forefront, offering immersive experiences while preserving delicate habitats.
Find flights with lower emissions for your next trip
Air travel plays a significant role in global carbon emissions, currently accounting for 2.4% of worldwide CO₂ emissions. Without intervention, this figure could rise to 22% by 2050.
Flying impacts the climate in more ways than just carbon emissions. Contrails—the white streaks left by planes—form clouds that trap heat, contributing to 60% of aviation's overall climate effect.
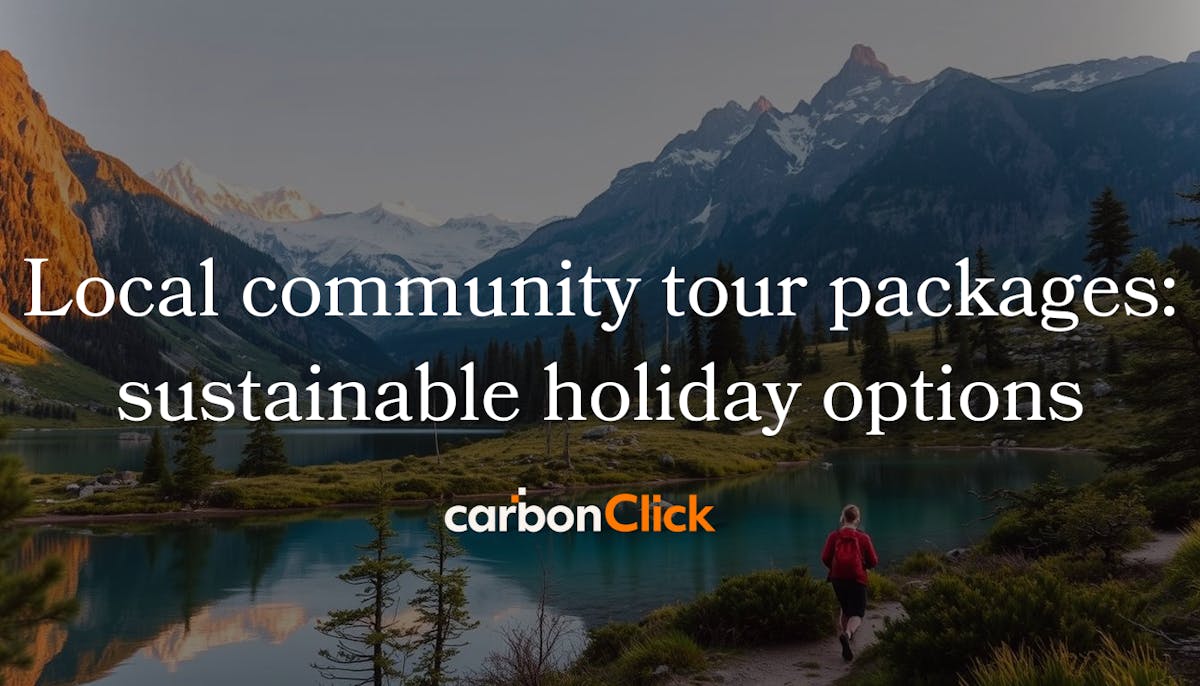
Local community tour packages: sustainable holiday options
Today, travellers seek enriching experiences that have a positive impact on both communities and the environment. Sustainable journeys create connections between visitors and destinations while safeguarding ecosystems and supporting local populations. Organisations such as Intrepid Travel collaborate with conservation groups to design responsible itineraries. In Shivadwar Village, Nepal, 34% of households participate in homestay programmes developed in partnership with WWF-Nepal.
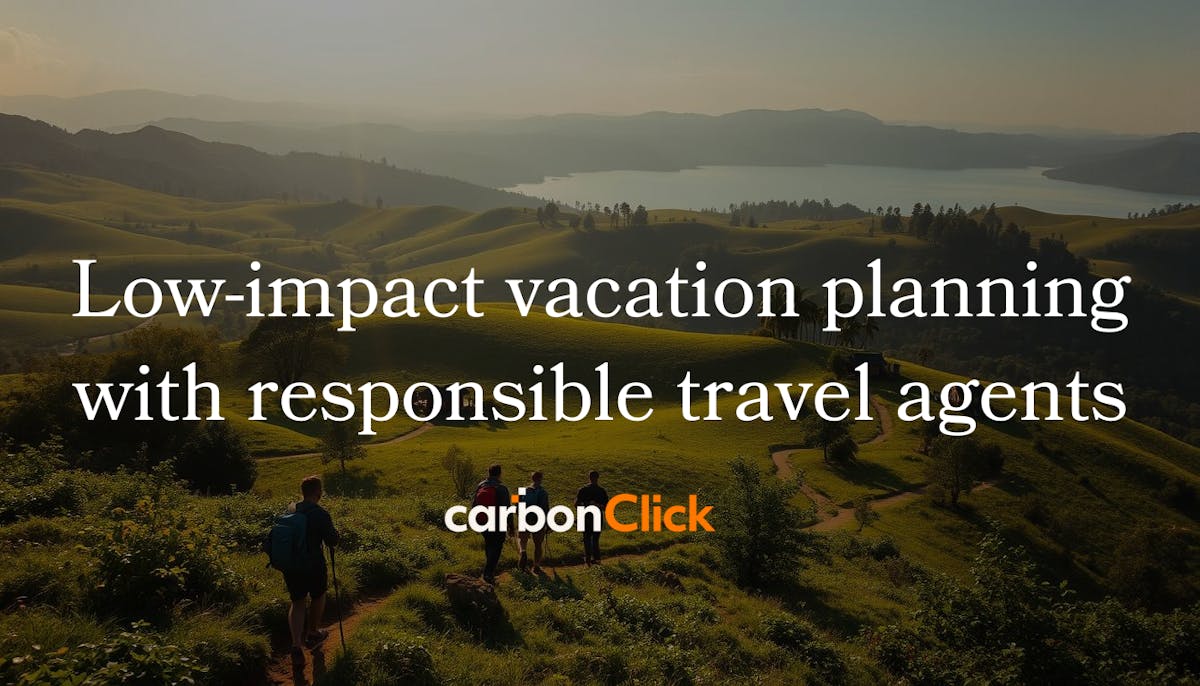
Low-impact vacation planning with responsible travel agents
An increasing number of travellers are now prioritising sustainability, with 83% considering environmentally conscious tourism important, according to a 2024 report. This shift is significant, given that tourism accounts for approximately 8% of global greenhouse gas emissions.
Booking trips in advance not only secures better prices and availability but also aids sustainable travel by alleviating the strain on resources caused by last-minute arrangements. McKinsey's 2024 projections underscore this growing trend.
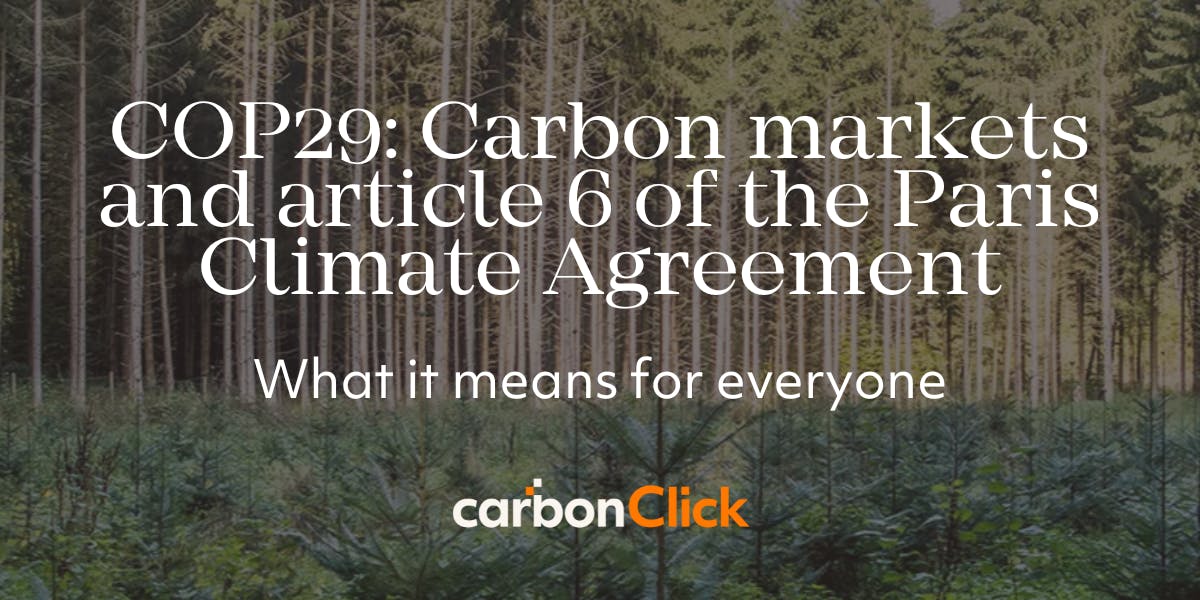
COP29: Carbon markets and article 6 of the Paris Climate Agreement – what it means for everyone
COP29 wrapped up at the end of 2024, and while the bulk of the news focussed on the new global finance goal (NCQG) to raise $1.3T annually by 2035, one of the most significant outcomes was the finalisation of the Article 6 Rulebook.
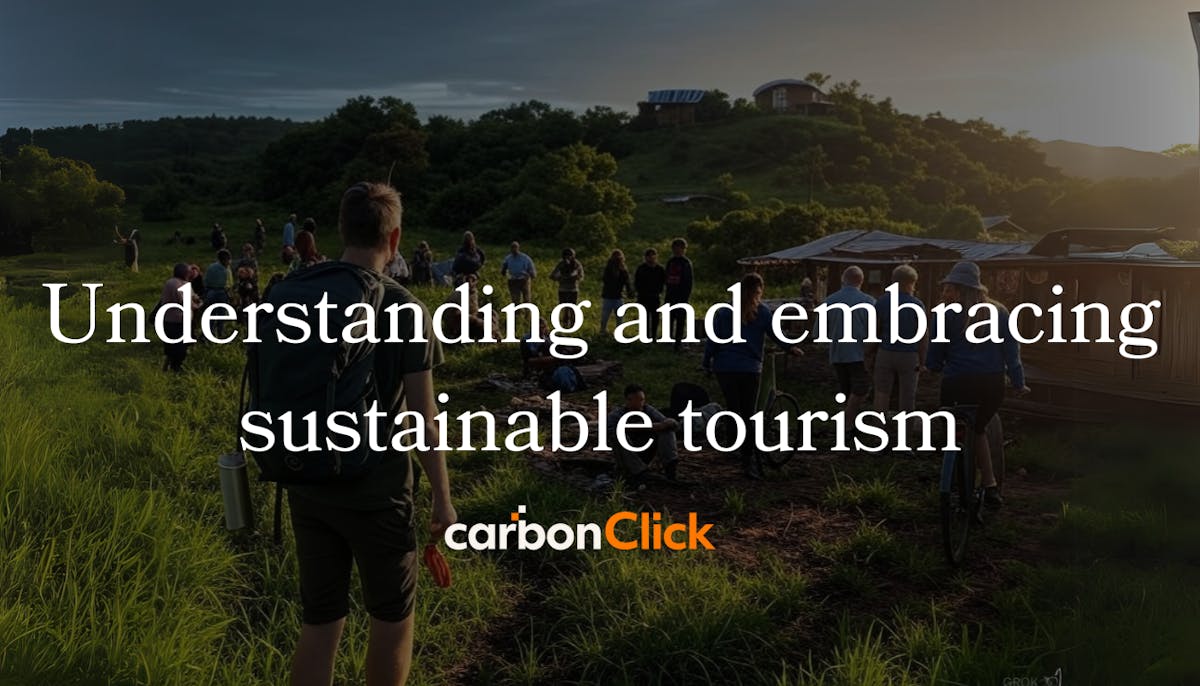
Sustainable tourism is more than just a passing trend—it is essential. It involves adopting practices that reduce the negative effects of tourism on the environment, economy, and local cultures. In simple terms, it is about enjoying travel while ensuring that destinations remain unspoiled for future generations. By understanding this approach, travellers can make informed choices that help maintain the long-term well-being of the places they visit.
Climate change: The untold angles the news fails to cover
As the world contends with the far-reaching effects of climate change, media coverage often centres on high-profile events, alarming statistics, and stark warnings from scientists. However, many important aspects of this issue remain overlooked. While headlines focus on rising temperatures, melting ice caps, and extreme weather events, a deeper and more complex narrative unfolds beneath the surface. Beyond the mainstream coverage, there are critical but underreported connections between climate and social justice, economic disparity, cultural shifts, and grassroots initiatives. This article explores these perspectives, highlighting the stories that deserve greater attention as we navigate the complexities of this global challenge.
Organic horticulture: Your ultimate guide to success
Did you know that organic farms support up to 30% more plant and animal species than conventional farms? This is just one reason why organic horticulture is gaining traction worldwide. It’s a system that combines centuries-old practices with modern techniques to grow healthy, sustainable food. Organic horticulture focuses on building nutrient-rich soil and using natural methods for pest control. Techniques like composting, mulching, and crop rotation are key. These practices not only boost crop production but also reduce environmental impact.
BYD Auto, a pioneering division of a multinational manufacturing conglomerate, has redefined the electric vehicle (EV) sector. Founded in 2003, the firm rose to prominence with the introduction of its BYD F3 model in 2005, a milestone that catalysed its trajectory towards technological innovation and sustainable development.
The environmental impact of cacao growing explained
The global chocolate industry is worth over $90 billion, yet its impact on the natural world remains a significant concern. Cocoa production, the foundation of this industry, relies on intricate supply chains that are often difficult to trace. This lack of transparency makes it challenging to tackle issues such as deforestation and carbon emissions.
Global negotiations have resumed at the UN Food and Agriculture Organisation headquarters in Rome, focusing on funding for biodiversity and conservation. These discussions are critical for addressing the ongoing decline in global wildlife, which has fallen by 73% over the past 50 years. Recent meetings, such as COP16 in Cali, ended without agreement due to disputes over financial contributions.
Why protect the environment: Understanding legal frameworks and global efforts
In today's world, understanding why we must protect the environment is more crucial than ever. This blog explores the evolving legal frameworks designed to safeguard our planet and highlights the global initiatives and obstacles we face in this essential endeavour.
Coffee sustainability: Pioneering new paths in coffee production
Coffee sustainability is becoming a pressing issue as traditional methods of coffee cultivation threaten both the environment and the livelihoods of farmers. Innovative approaches, led by visionary growers like David Benitez, are transforming the coffee industry, ensuring that both the planet and its people thrive.
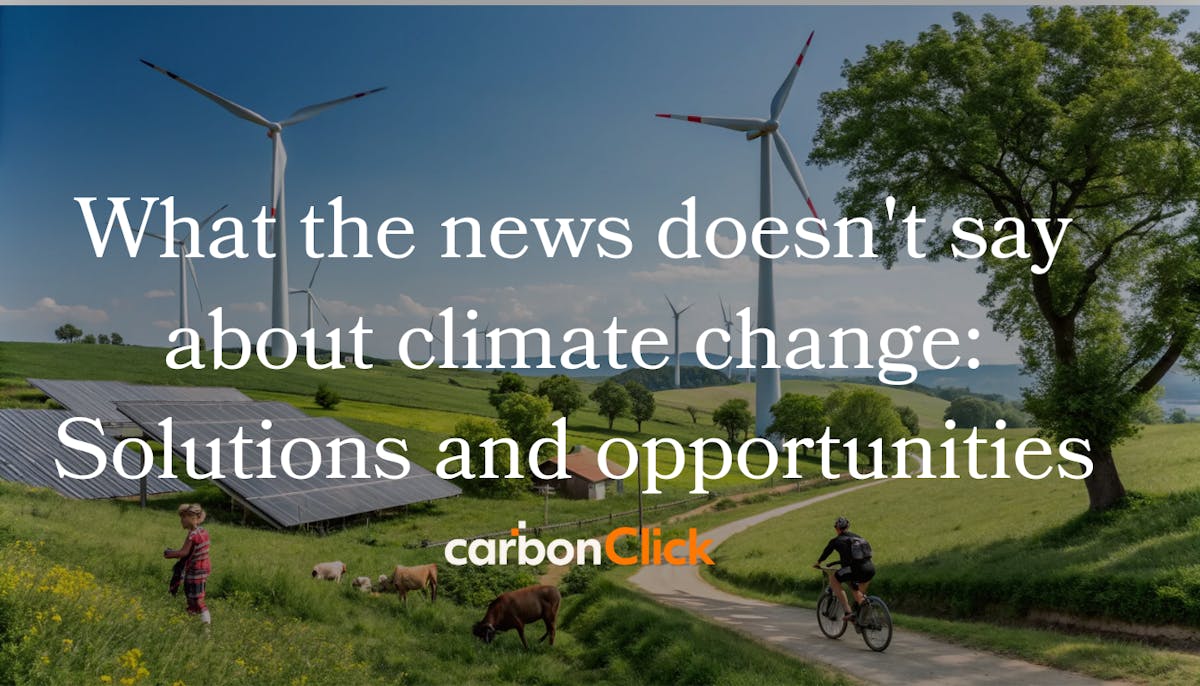
What the news doesn't say about climate change: Solutions and opportunities
In a world filled with doom and gloom narratives about climate change, it's crucial to explore what the news doesn't say about climate change. As Hannah Ritchie highlights, the challenges we face are not insurmountable, and there are actionable solutions that can lead us towards a more sustainable future.
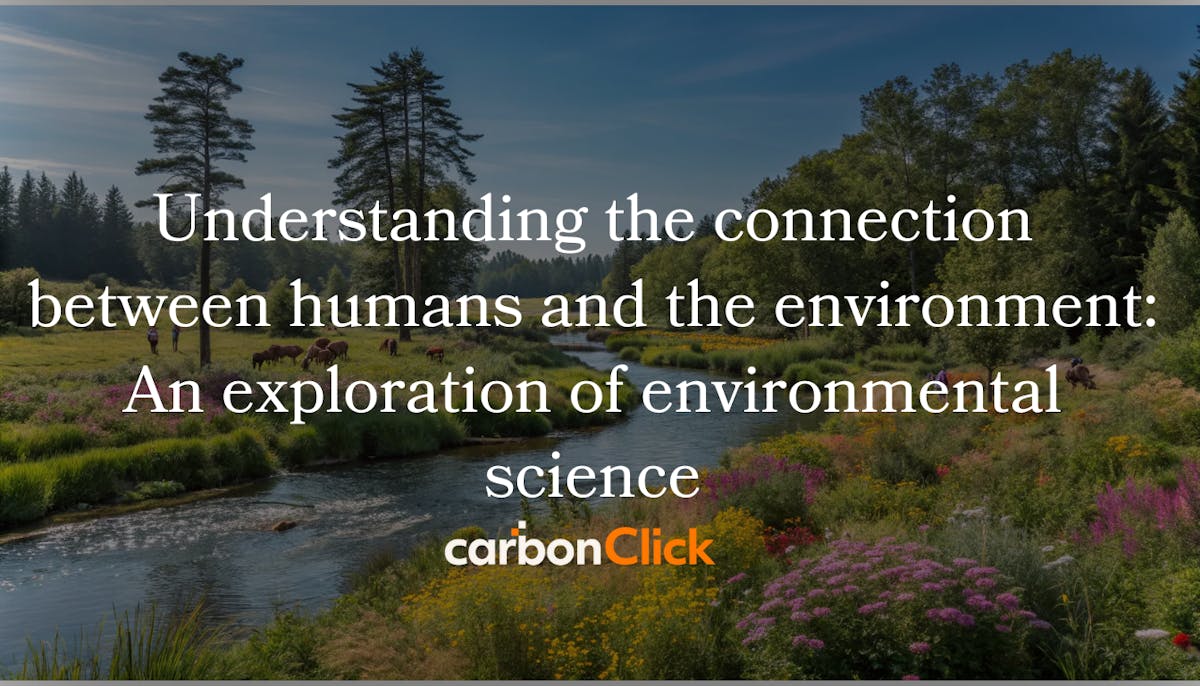
Understanding the connection between humans and the environment: An exploration of environmental science
In our quest to understand the intricate relationship between humans and the environment, we uncover the profound impacts of our actions on the natural world. This blog delves into the essentials of environmental science, highlighting how our existence is intertwined with the health of ecosystems and the urgent need for sustainable practices.
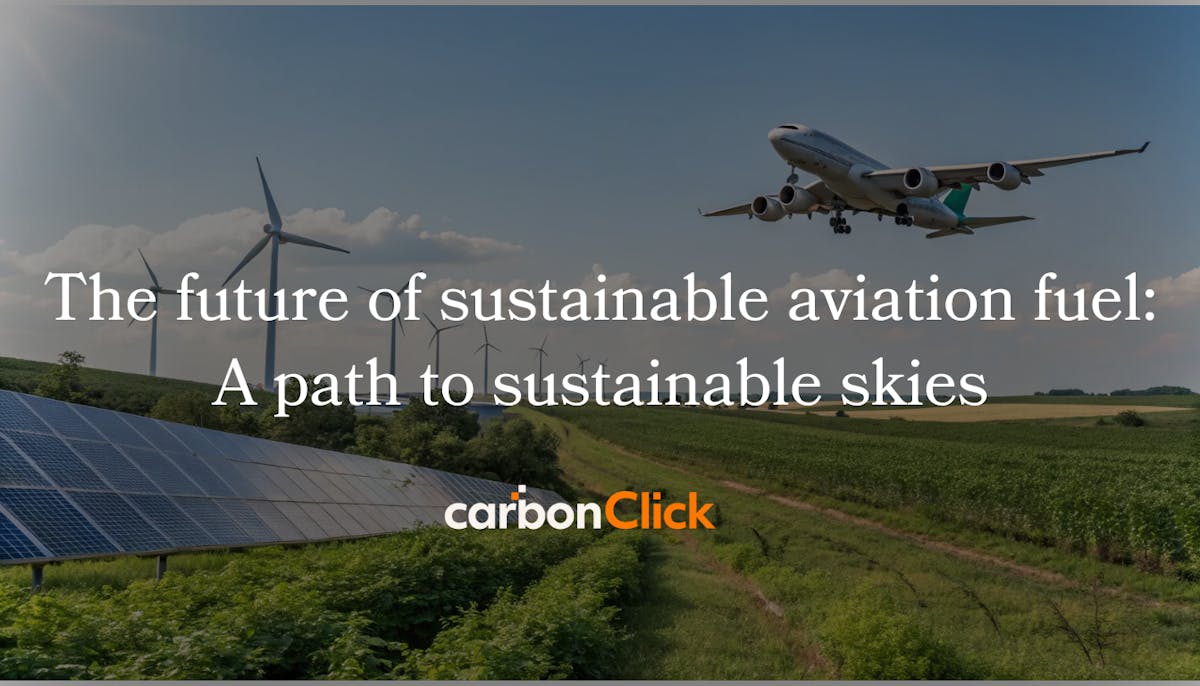
The future of sustainable aviation fuel: A path to sustainable skies
As the aviation industry faces increasing pressure to reduce carbon emissions, sustainable aviation fuel (SAF) emerges as a promising solution. This blog explores the potential of SAF to transform air travel, the challenges of scaling production, and the implications for airlines and passengers alike.
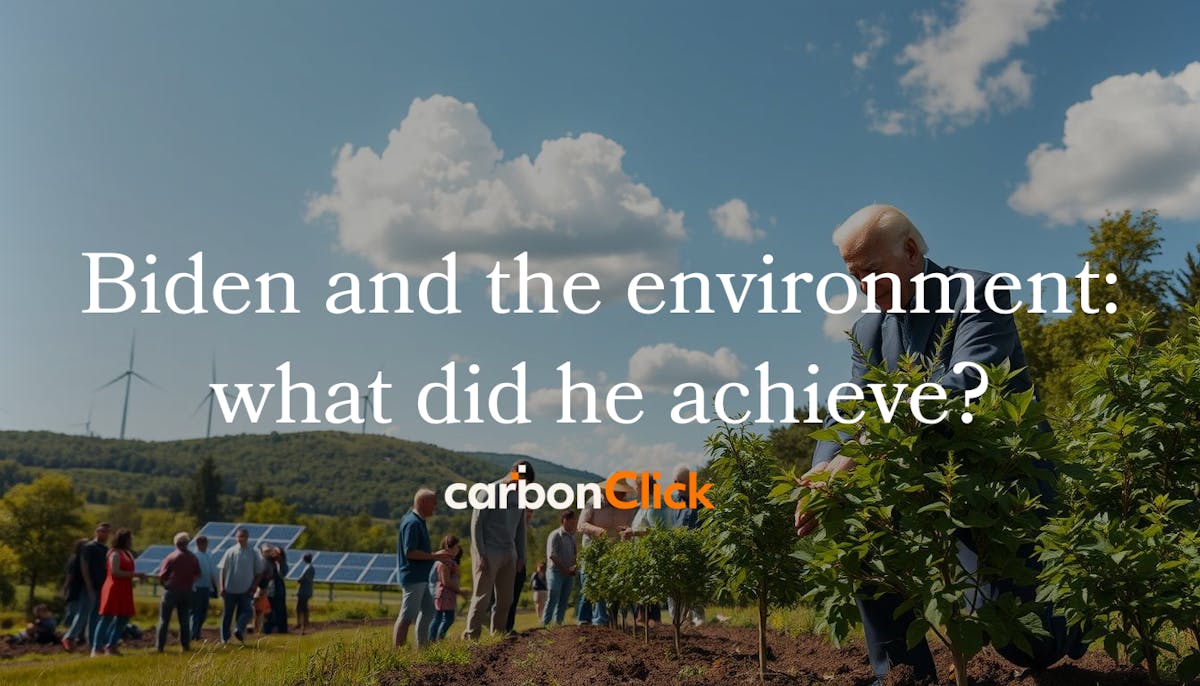
President Biden has made significant strides in addressing climate change and advancing sustainability. The Biden administration has seen notable progress in environmental protection, owing to key legislation passed. His approach aims to reduce climate change's impact and foster sustainable practices.
The Trump administration implemented 74 actions to weaken environmental protection regulations, which is accurate according to research by various environmental law organisations. These actions indeed affected environmental protections in multiple ways. Most notably, they reversed environmental regulations and removed restrictions on oil and gas exploration in the Arctic National Wildlife Refuge, which is also factually correct. This forms a significant part of the environmental policy developments during Trump's presidency.
EU countries are set to miss these 2025 environmental targets
The European Union has established several environmental targets for 2025, encompassing carbon emissions reduction and waste management improvements. These objectives form part of the EU's broader sustainability framework and environmental commitments. These targets aim to reduce the EU's environmental impact and advance sustainability practices.
2024 was a year of substantial transformation for our Earth. We're witnessing increased public action to address environmental challenges. This demonstrates our collective capability to resolve significant ecological issues.
Renewable energy adoption continues to accelerate, whilst innovative approaches to environmental conservation emerge. Governments, corporations, and community organisations are forming partnerships. Their collaborative efforts focus on creating lasting environmental sustainability.
The environmental impact of electronics production and disposal
The production of electronic devices consumes substantial energy. It requires rare Earth metals and complex manufacturing processes that generate significant emissions. This results in environmental degradation through pollution from both manufacturing and disposal of electronics.
Celebrating responsibly: A sustainable holiday season
The holiday season is a time for joy, celebration, and togetherness. However, it can also be a period of increased consumption and environmental impact. From increased travel to a surge in packaging and energy consumption, the holiday season can significantly contribute to our carbon footprint.
Navigating the carbon footprint of travel: From events to corporate trips
In an era marked by increasing climate concerns, the travel industry stands as a significant contributor to global carbon emissions with aviation emissions accounting for 2.5% of global CO2 emissions. From bustling events to corporate travel, the environmental impact of travel is undeniable.
AZAL partners with CarbonClick to offer fully integrated carbon offsetting solution for passengers
Azerbaijan's national air carrier, AZAL, has launched a voluntary carbon offset programme for passengers in partnership with New Zealand based carbon offset provider and climate-tech firm CarbonClick.
CarbonClick and SCB Group come together to offer complete carbon credit solution to accelerate the aviation industry’s journey to Net- Zero
New Zealand based carbon offset provider and climate-tech firm CarbonClick and the world's leading low carbon commodity company SCB Group are joining forces to offer a new complete end-to-end solution which will improve and streamline airlines’ approach to assessing and offsetting their carbon impact.
Bogged down in carbon: the role of peatlands in offsetting carbon emissions
While forests often take center stage in discussions about carbon sequestration, there's another critical ecosystem silently playing a vital role: peatlands. Often referred to as bogs, fens, and moors, these unique landscapes hold immense potential in addressing climate change.
The role of airports to reduce carbon emissions in aviation
Airports are not merely transit hubs; they play a crucial role in the broader ecosystem of reducing co2 emissions in aviation. As the aviation industry strives to reduce its environmental footprint, airports are actively transforming their operations, infrastructure, and policies to support this critical goal for the future of air travel.
Here at CarbonClick, we're all about making carbon offsetting meaningful and effective. That's why we're thrilled to be ICROA accredited. But what exactly is ICROA, and why does it matter?
Amadeus launches Travel Impact Suite, enriching sustainability data for all travel sellers
Amadeus has announced a significant advancement towards more sustainable travel with the launch of Travel Impact Suite, including the integration of the Travel Impact Model, which has been endorsed by Travalyst. This solution, automatically implemented at no additional cost, provides the data and technology for travel sellers to highlight the environmental impact of a flight so that they are able to make more sustainable decisions.
The urgency of climate change demands innovative solutions. Rewilding – the large-scale restoration of natural ecosystems – emerges as a powerful tool. It's a natural path towards addressing climate change, fostering biodiversity and ecological resilience along the way.
Engaging fans and spectators: Key allies in reducing Scope 3 emissions
This Summer is a huge moment internationally for sport, with UEFA EURO 2024 underway and the 2024 Summer Olympics on the approach, a significant portion of live event emissions stem from spectator travel. It's important to explore how audiences can positively contribute to addressing scope 3 emissions, and find effective ways to empower and encourage them to offset these emissions.
Businesses are increasingly prioritising sustainability, and credible, high quality carbon credits are a valuable tool in their climate action toolbox. However, navigating the complexities of the carbon credit market - which is often described with jargon terminology and a myriad of acronyms - can be challenging.
Magnit Partners with CarbonClick to Launch Innovative Sustainability Initiative, Empowering Workers to Reduce Carbon Footprint
Magnit™, an Integrated Workforce Management (IWM) platform provider, unveiled its new Carbon Offsetting Program, created in partnership with leading green tech firm CarbonClick
The role of carbon offsetting in a net-zero future for aviation
To reach net zero by 2050, an urgent dialogue between aviation industry leaders on best practice is needed to bridge this gap with actions that can and should be taken right now including carbon offsetting as a short to medium term solution.
Taking flight: a reduced-emission future for aviation
The aviation industry connects people and places across the globe, but its environmental impact remains a significant challenge. However, exciting advancements are taking place, aiming to minimise this impact and pave the way for a reduced-emission future.
Ever heard of carbon offsetting but unsure about the different certifications involved? You're not alone! It’s important you understand what these certification mean. This way, you can make sure you’re only supporting climate projects that are doing good for the planet and people.
Could future live events help cool the planet? How London’s O2 removed over 540 tonnes of carbon during pilot event
Last week, London's O2 arena publicised the results from its carbon removal pilot. Fans of The 1975 contributed to carbon removal projects when purchasing tickets to the band's February shows at the London event location.
Where climate action meets hospitality: The rise of sustainably progressive hotels
Travellers, business and leisure alike, are increasingly seeking experiences that align with their values. Sustainability is becoming a top priority for many. This has led to the rise of climate-conscious hotels, which are transforming the hospitality industry by actively implementing practices that minimise their environmental impact.
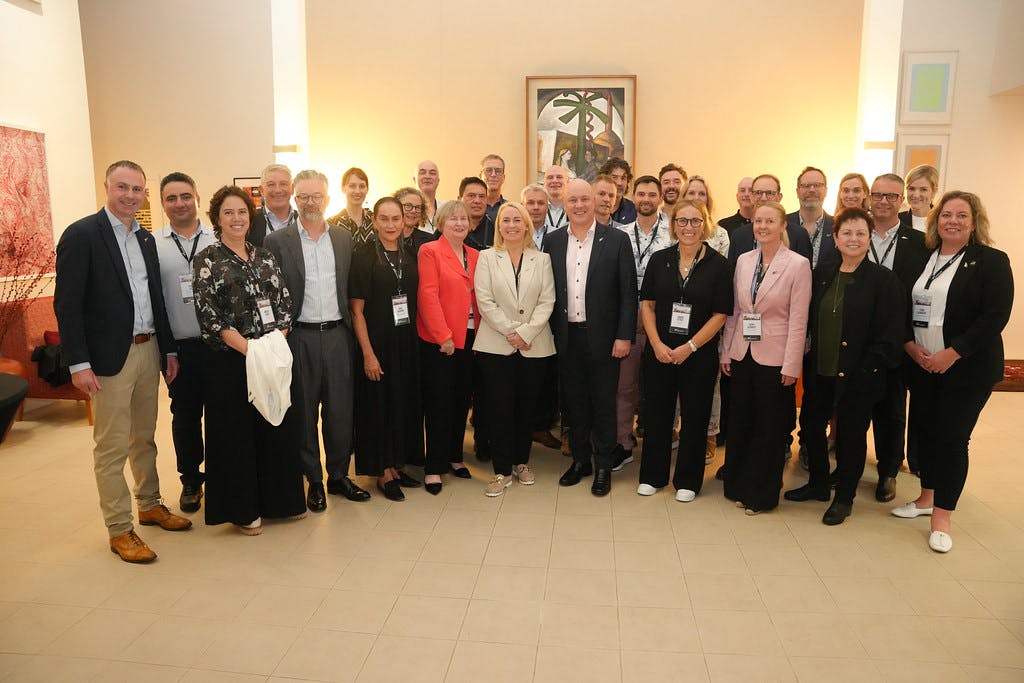
CarbonClick to represent green tech innovation in NZ Government mission to boost Southeast Asia trade relations
APRIL 2024: Leading New Zealand green tech firm, CarbonClick, has been selected to join a Government mission to strengthen trade relationships with South East Asia.
The journey towards addressing climate change demands continuous innovation, particularly in the realm of carbon offsetting. While traditional methods have played a crucial role, limitations in effectiveness and transparency have necessitated the exploration of novel technological solutions.
The magic of forests: How tree planting contributes to carbon offsetting
Envision a natural solution to address climate change: forests! These leafy giants act as Earth's lungs, playing a vital role in carbon sequestration, the process of capturing and storing carbon dioxide from the atmosphere. This article explores how tree planting projects contribute significantly to carbon offsetting, helping to reduce our environmental impact.
CarbonClick appointed as the designated offsetting partner for the Singapore Airshow
CarbonClick today announces its collaboration with the Singapore Airshow, to allow visitors to offset their flight emissions in a simple, transparent, and meaningful way through certified, credible and recognised methods of offsetting.
Changi Airport Group launches Changi Carbon Offsets, allowing travellers to offset emissions from air travel
Changi Airport Group (CAG) has launched Changi Carbon Offsets, giving passengers a convenient option to offset the carbon emissions from their air travel, regardless of the airline that they are travelling with.
Air Chathams' carbon offset journey with TTI and CarbonClick
The partnership between TTI and CarbonClick empowers all of TTI's airline clients to seamlessly implement the solution and incorporate it into their passenger booking systems in just a matter of days. Air Chathams proudly became the first TTI customer to adopt this innovative carbon offset solution.
Travel Technology Interactive (TTI) and CarbonClick announce a partnership to deliver a fully integrated voluntary carbon offsetting solution for all of TTI’s airline customers
The partnership enables an end-to-end IBE (Internet Booking Engine) carbon offsetting solution, which is the first to be fully integrated into a single PSS (Passenger Service System).
Sustainability is a way of thinking about how to meet the needs of the present without making it harder for future generations to do the same. It includes economic, biological, and social factors, and it is very important if we want our planet to have a healthy and stable future.
So you’ve been hearing about climate change and are starting on a personal sustainability journey… but you keep hearing about carbon and carbon footprints. But what on Earth is a carbon footprint?!
We’ve created the world’s easiest carbon footprint calculator!
Our carbon footprint is the total amount of greenhouse gases that are generated by our lives. This footprint is our contribution to the warming of our planet and causes climate change.
It’s a beautiful thing, being a B Corp. It’s one of the ways we walk the talk of being a sustainable, transparent, accessible, collaborative, and innovative business.
We source and support a wide range of exciting projects, from forest renewal to clean energy generation. All of them are able to do their good work thanks to carbon financing.
Protecting bees: how to save our vital pollinators
Bees are key for our planet, helping pollinate about 80 percent of crops worldwide. Unfortunately, they face many dangers, like losing their homes and getting hurt by pesticides. Saving bees is critical, not just for them but for our food and the planet as a whole.
Removing PFAS (forever chemicals) from your drinking water
The presence of PFAS (per- and polyfluoroalkyl substances) in drinking water has been a growing concern for many people in recent years, especially due to the potential health impacts associated with long-term exposure.
Carbon capture technology is an increasingly important part of our fight against climate change. This technology captures carbon dioxide (CO2) from the air, from power plants, industrial processes, and other sources and stores it away from the atmosphere.
The latest IPCC report focuses on mitigating climate change, to limit warming to 1.5 degrees
The IPCC (Intergovernmental Panel on Climate Change) report is a comprehensive scientific assessment of the state of knowledge regarding the Earth’s climate and its changing climate system.
Using business as a force for good: Exploring the world of B Lab, B Corp, and B Corp month
B Lab is a non-profit organisation that became known for certifying B Corporations, which are companies that meet high standards of social and environmental performance, accountability, and transparency.
Customers of Australia and New Zealand's no 1 outdoor brand Kathmandu, will be able to offset part of their environmental impact at checkout. By paying $2.00, Kathmandu customers transacting online will contribute directly to offsetting projects in Australia and New Zealand.
How we can reduce and eliminate plastic’s environmental and climate impact
All aspects of contemporary life, from packaging and home products to clothes and medical equipment, make use of plastics. While plastics have many practical applications, their long shelf life and resistance to disintegration also make them a serious threat to the environment.
Deforestation’s impact on the climate, wildlife and ecosystems
Clearing forests for uses like agriculture, urbanization, and resource extraction is known as deforestation, and it has far-reaching consequences for the environment and its inhabitants. Both the direct effect of deforestation (which upsets the ecological balance) and the indirect impact (which adds to global warming) are real and significant.
The current status of the world’s 10 most endangered species
In the field of ecosystem impact on wildlife, and of interest to conservation biologists and those who love animals, here is the latest information on the fate of some of the planet’s rarest creatures.
Did you know Canada's mining industry is a big deal, employing about 700,000 people every year? It contributed a significant $107 billion to Canada's GDP in 2021. Our country is facing major environmental challenges that need rapid and substantial changes. We aim to cut emissions by 40 to 45% below 2005 levels by 2030 and achieve net-zero by 2050. This plan includes substantial investments in clean energy and new technologies to build a robust, low-carbon economy.
How to reduce the environmental impact of your home
Starting to tackle climate change begins at home. We can do this by driving less and recycling more. It's also key to understand how much energy our homes use. For example, in Michigan state, homes use about 3,948kW of energy each month. By doing an energy audit, we can see where we can cut down on energy use. This helps us lessen our impact on the environment.
The ripple effect: Understanding the global impact of Amazon deforestation
Did you know the Amazon Rainforest, covering over 5.5 million square kilometres, is disappearing at an alarming rate? In just three decades, an area comparable to the size of West Virginia has been cleared in Rondônia. This essential ecosystem is experiencing a significant environmental crisis.
The effects of deforestation are profound, transforming our natural surroundings and endangering our future. We are at a critical juncture where understanding and addressing this issue swiftly is imperative.
The carbon footprint of electric vehicles: A comprehensive analysis
In recent years, the discussion surrounding electric vehicles (EVs) has gained considerable traction due to their potential to reduce greenhouse gas emissions when compared to traditional petrol-powered cars.
The economics and practicalities of home solar panels. Time to break even etc
The economics and practicalities of home solar panels involve understanding costs, savings, and break-even periods. Typically, homeowners recoup their investment within six years.
Did you know 2023 was the second warmest year for the UK? It followed the record-breaking heat of 2022. This indicates significant changes in our environment. The last decade saw six of the warmest years since 1884.
How NZ dairy farmers are balancing production with the environment
New Zealand dairy farmers lead in sustainable practices, efficiently producing milk with significantly reduced emissions, fostering environmental stewardship.
The current state of the United States' environment
Cherry trees in Washington, D.C., bloom earlier now, showing how the climate is warming. The Environmental Protection Agency (EPA) has just released a new report on climate change in the United States. This report illustrates how our actions are affecting the environment.
How the new EU agricultural policy is transforming farming practices
Did you know that nearly half of the European Union's land is dedicated to agriculture? This extensive area is set to benefit from the CAP 2023-27 reforms, which aim to make farming more sustainable and lessen its environmental impact.
On 2 December 2021, the European Union's member states agreed to simplify and modify the Common Agricultural Policy (CAP) regulations. Beginning on 1 January 2023, this new policy aims to achieve better integration of social, environmental, and economic objectives in agriculture, aligning with the goals of the European Deal.
Did you know Volkswagen's "Dieselgate" scandal impacted approximately 11 million vehicles worldwide? This number far exceeds the 482,000 cars in the US that were initially reported. It stands as one of the largest scandals in the car industry’s history.
Australia faces significant environmental challenges, such as a decline in biodiversity and damage to habitats. Our research indicates that many ecosystems are under considerable stress. This is primarily due to climate change and human activities, such as deforestation and urban development.
The environmental impact of current-generation electric vehicles, manufacturing and running
Electric vehicles, or EVs, are becoming key in improving climate change. Big names like General Motors and Volvo are going all-electric, changing the car industry. The effect on the environment depends on how they're made and powered.
Did you know that 94% of New Zealand's reptiles are at risk of disappearing? This fact, from the Environment Aotearoa 2022, shows how our biodiversity is struggling. The report, released every three years, uses almost 50 indicators to check the state of our environment and its effect on our health.
How new hydrogen engine technologies are set to transform the automotive industry
Did you know that next-generation hydrogen engines could arrive as early as 2025? Hyundai and Kia are leading the charge with these engines, which promise to change the landscape of environmentally conscious transport. With a 3.5-litre displacement and 30.6 kg·m torque, these engines are set to establish new standards for alternative fuel vehicles.
Hydrogen combustion engines are poised to transform environmentally conscious transport. They operate similarly to traditional engines but are far cleaner. By burning hydrogen, they aim to deliver a comparable driving experience and quick refuelling, all while emitting only water vapour.
Climate action for the ocean in the US: save marine life today
The world is facing a significant crisis due to climate change. Protecting our oceans is now more urgent than ever. In the United States, climate change is harming marine life, disrupting the natural systems of our oceans. However, by working together, we can make a real impact and safeguard our oceans for the future.
For a long time, carbon has been referred to as the basic unit of life. Plants and animals are both made up of the non-metallic chemical element carbon. Fats, carbohydrates, proteins, and DNA are all examples of where it may be found in the biosphere as whole.
Effective ways to reduce your carbon footprint today
Climate change is a pressing issue, and it’s essential for everyone to take action. This article offers simple steps to live more sustainably. These adjustments can help reduce your carbon footprint and contribute to a healthier environment.
USA sustainable development and climate action goals
The United States is playing a leading role in ocean conservation through initiatives spearheaded by the federal government, non-profits, and local communities. Recent efforts include policies aimed at preserving marine biodiversity, advancing sustainable economic activities, and empowering coastal communities. Programmes such as the National Ocean Biodiversity Strategy and the Sustainable Ocean Economy Plan focus on addressing critical challenges like overfishing, biodiversity loss, and pollution. These initiatives also support Indigenous practices and equitable resource management while promoting ocean-based industries such as renewable energy and sustainable fisheries.
The urgency to practice environmentally friendly farming methods is greater than ever. Did you know that about 40% of the global population works in agriculture, making it a significant contributor to carbon emissions?
US climate change goals for 2030: key targets & actions
The United States is addressing the challenge of reducing greenhouse gas emissions through an ambitious strategy. By 2030, it aims to achieve a 50-52% reduction in emissions compared to 2005 levels, working towards its broader target of net-zero emissions by 2050. This multi-faceted plan focuses on renewable energy sources such as solar, wind, and hydropower, alongside improvements in energy efficiency.
How does climate change affect the biodiversity of marine ecosystems
Climate change poses a significant threat to marine ecosystems across the globe. Rising global temperatures and increased absorption of carbon dioxide by the oceans are having profound effects on marine life. These changes, ranging from warmer surface waters to more acidic deep waters, are creating severe challenges for marine species.
Are you wondering how planting trees can help combat climate change? Forest carbon credits are an essential tool - they allow companies and individuals to voluntarily offset their emissions by investing in projects that protect or restore forests.
Boeing and Airbus' sustainable aviation fuel initiatives
The aviation industry is indeed shifting rapidly, with Boeing and Airbus playing prominent roles in promoting Sustainable Aviation Fuel (SAF). Boeing, working with the U.S. Department of Transportation and the FAA, is committed to advancing SAF use both domestically and internationally, especially among Asia-Pacific countries.
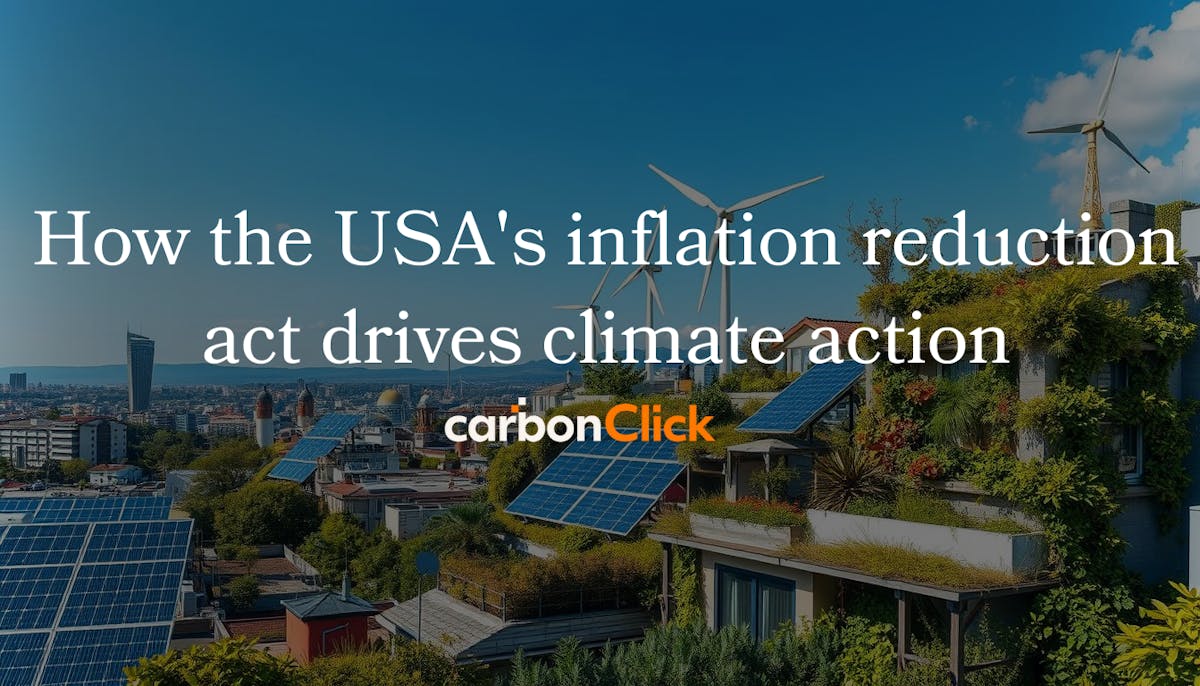
How the USA's inflation reduction act drives climate action
The United States made a significant move towards addressing climate change with the Inflation Reduction Act. This legislation, signed into law in 2022, allocates $369 billion to boost renewable energy and reduce greenhouse gas emissions. It marks the largest investment in American history towards energy and climate initiatives.
As we face the climate crisis, we all have a key role to play. Simple, sustainable lifestyle choices can make a significant difference. This article will show you easy ways to live more sustainably and help our planet.
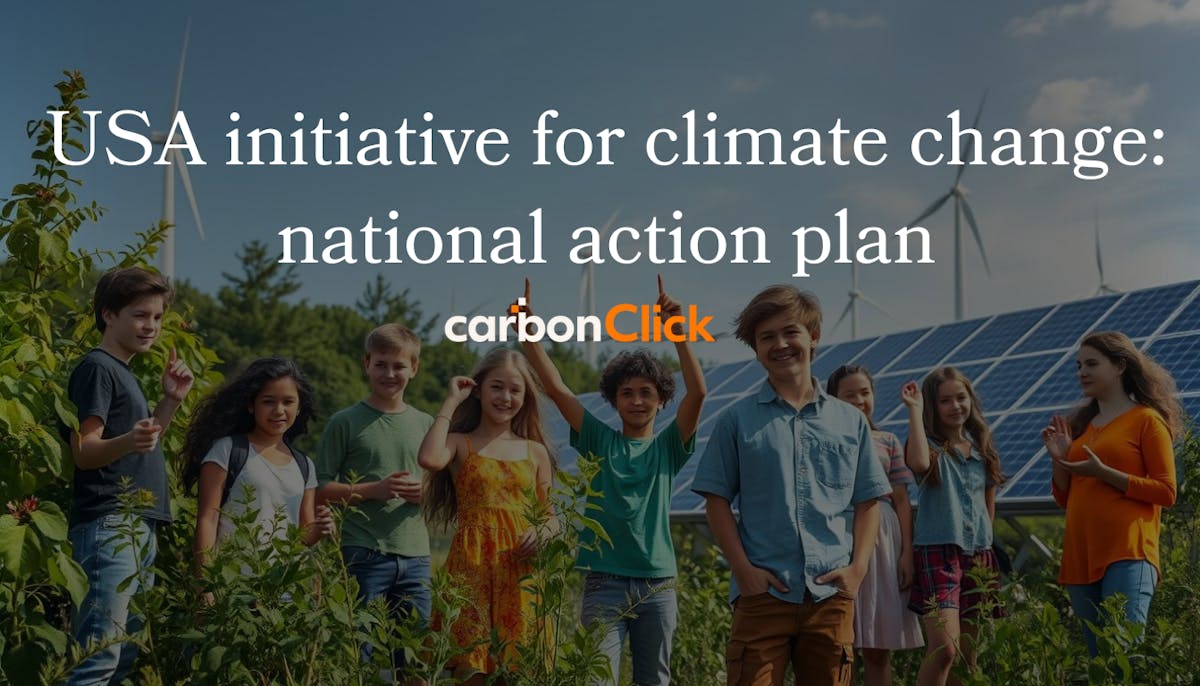
USA initiative for climate change: national action plan
The United States has launched a comprehensive approach to address its climate challenges, though some specific references in your original paragraph may need clarification or adjustment.
The Biden-Harris administration has introduced numerous initiatives to tackle climate issues, including a National Climate Resilience Framework. This framework focuses on adapting infrastructure and policy to reduce vulnerabilities while investing heavily in renewable energy and innovative technologies. For example, federal agencies, under Executive Order 14008, are coordinating efforts to reduce emissions, improve energy efficiency, and enhance resilience across.
Sustainable aviation fuel (SAF) is an environmentally sound alternative to traditional jet fuel. It aims to reduce the carbon footprint of flying. The global aviation industry is striving for carbon neutrality by 2050, and SAF is a crucial component of this strategy.
SAF programs in the USA: sustainable aviation fuel initiatives
We’re excited to dive into the SAF programme in the United States. It’s all about making air travel more sustainable. The programme encompasses various components, such as policies and funding, to facilitate the increased use of sustainable aviation fuel.
What sustainable aviation fuel programs exist today?
Sustainable aviation fuel (SAF) is produced from non-petroleum sources and helps reduce emissions from flying. The International Civil Aviation Organization (ICAO) reports that over 360,000 flights have utilised SAF at 46 airports, primarily in the US and Europe.
How SAF is produced - a sustainable aviation fuel guide
Sustainable aviation fuel (SAF) is a relatively new alternative fuel derived from non-petroleum sources. It can be blended with standard jet fuel to help reduce emissions in aviation. To date, SAF has powered over 450,000 flights worldwide, with major uptake in the US and Europe, where more than 50 airlines and numerous airports have supported its integration into commercial flights.
Exploring the real costs of sustainable aviation fuels
Reducing greenhouse gas emissions is a major challenge today. Sustainable aviation fuels (SAFs) are key to making aviation more sustainable. They help cut CO2 emissions. But, the cost premium for SAF compared with fossil kerosene is a big issue for the aviation sector.
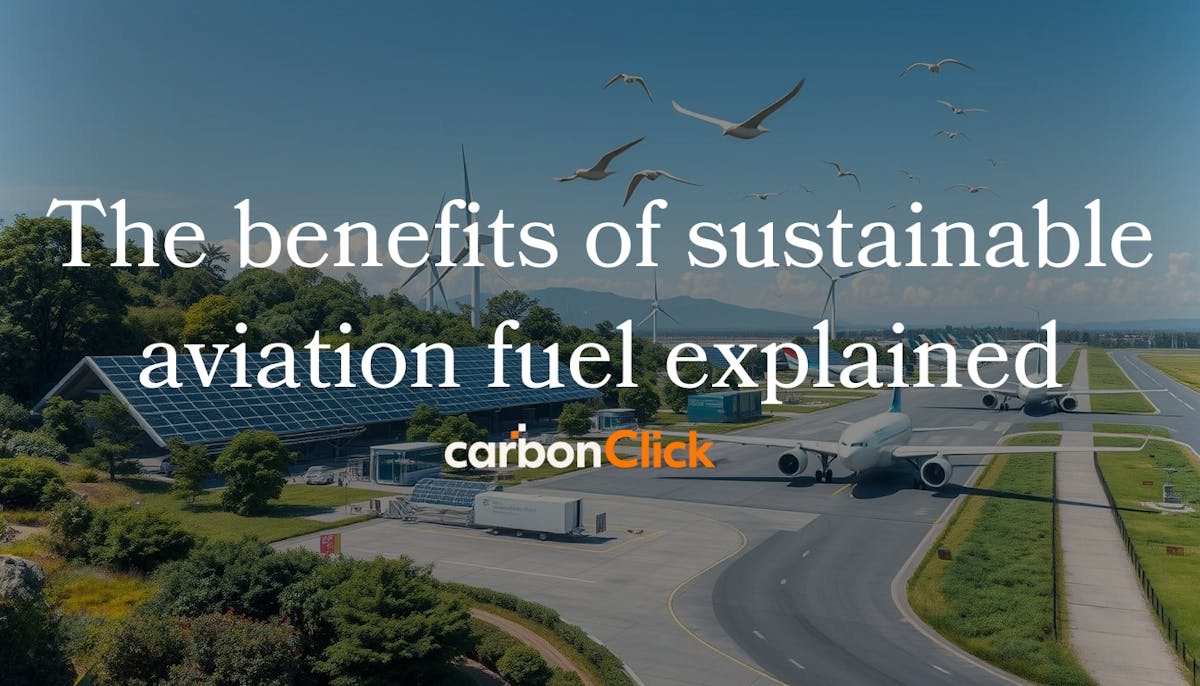
The benefits of sustainable aviation fuel explained
Sustainable aviation fuel (SAF) is a critical solution in reducing aviation’s environmental impact. The global aviation sector aims to reach net-zero carbon emissions by 2050, and SAF is a significant contributor to this target. As of now, more than 360,000 commercial flights have used SAF across 46 airports, mostly in the United States and Europe, underscoring SAF’s growing role in the industry.
Exploring the different types of sustainable aviation fuel
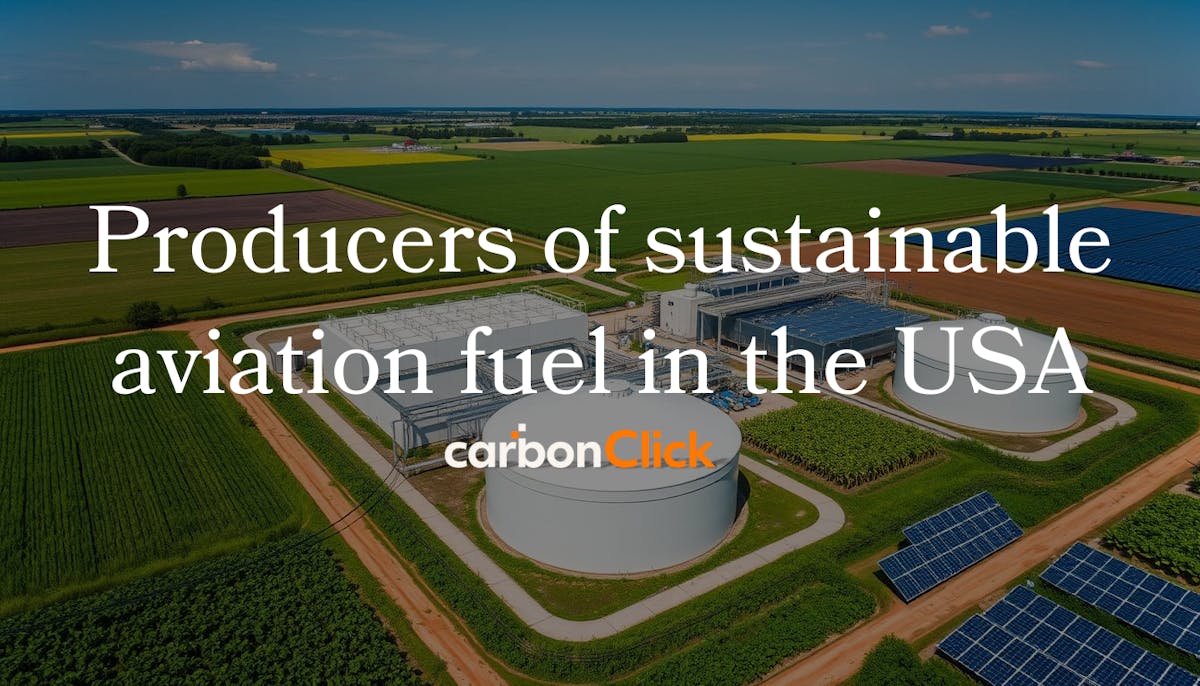
Sustainable aviation fuel (SAF) is transforming the aviation industry. It can reduce carbon dioxide (CO2) emissions by up to 80% compared to conventional jet fuel. This makes it a crucial step towards making air travel more sustainable.
In the United States, several producers of sustainable aviation fuel (SAF) are at the forefront of a future with lower emissions in aviation. These companies employ innovative technologies and various biojet feedstocks to develop alternative aviation fuels.
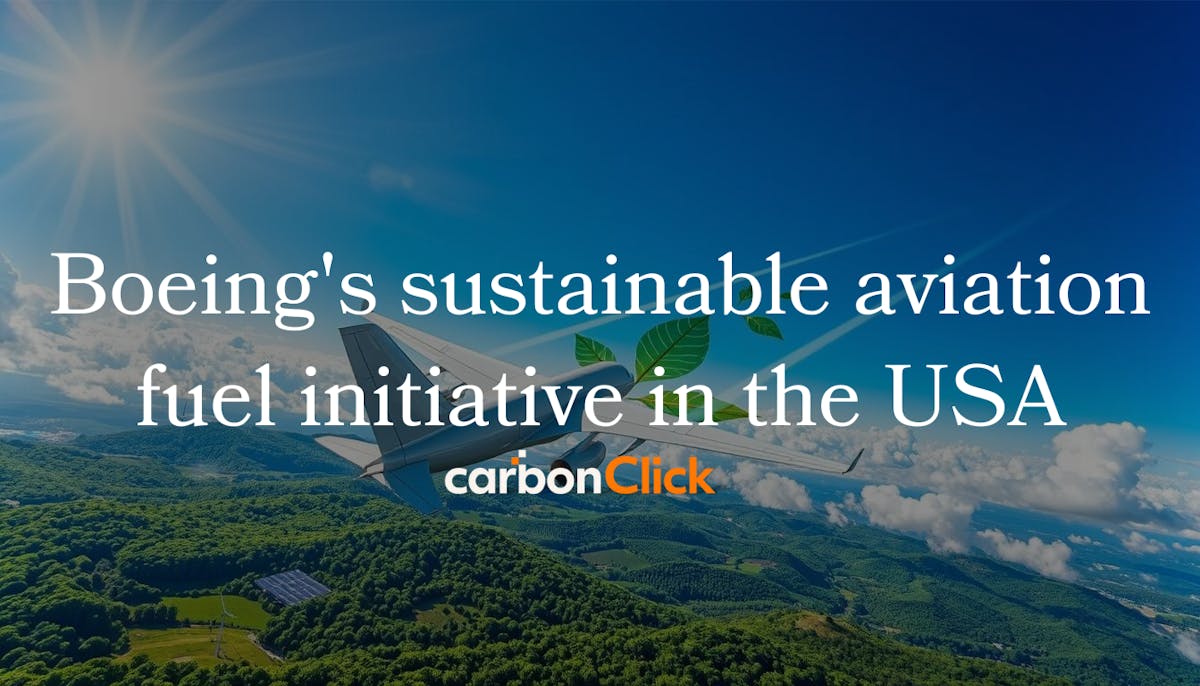
Boeing's sustainable aviation fuel initiative in the USA
Boeing, the world’s largest aircraft and aerospace company, has embarked on a new project to enhance Sustainable Aviation Fuel (SAF) usage across the U.S. and globally, aiming to make air travel fully carbon-neutral by 2050. The company plans to leverage its resources and partnerships to reduce the environmental impact of aviation by lowering emissions and advancing SAF technology.
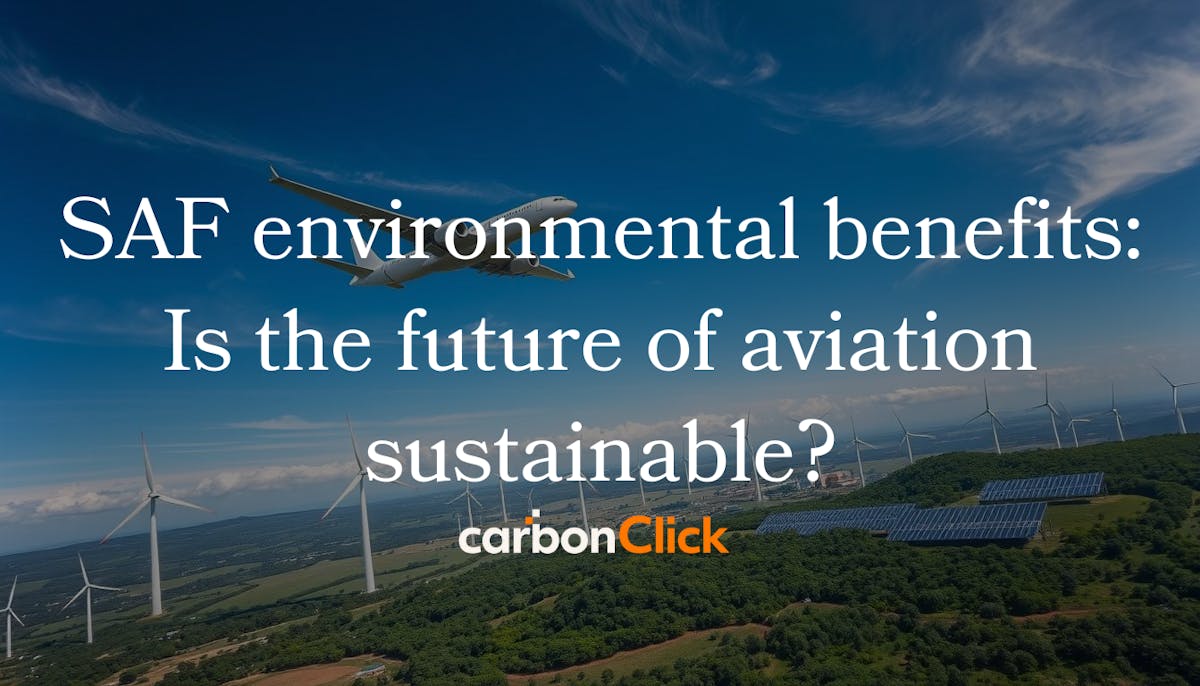
SAF environmental benefits: Is the future of aviation sustainable?
We are on the brink of a new era in aviation. This era is marked by the rise of Sustainable Aviation Fuel (SAF). It's an alternative energy source that could significantly reduce the industry's carbon footprint.
How does SAF reduce emissions? Exploring its benefits
Sustainable Aviation Fuel (SAF) indeed holds promise for reducing aviation's environmental impact by offering up to an 80% reduction in carbon dioxide (CO₂) emissions across its lifecycle compared to traditional jet fuels. SAF is derived from renewable sources, such as used cooking oil, waste animal fats, and other biomass. This closed-loop process involves CO₂ absorption by feedstock materials like plants during their growth, which is later released upon combustion in an aircraft engine, aligning CO₂ levels in a more sustainable cycle rather than adding new emissions from fossil sources.
We are on the verge of a revolutionary shift in powering our aircraft. This is thanks to plant-based aviation fuels, also known as sustainable aviation fuel (SAF). These fuels, made from renewable sources, promise to greatly reduce air travel's impact on the environment. SAFs can be mixed with regular jet fuel, making them easy to use in current planes and systems without significant changes.
Our food choices have hidden costs that can be revealed through a deep dive into true cost accounting.
In discussions about food, the focus often lands squarely on prices. Consumers are naturally drawn to the allure of savings, with supermarkets advertising deals that make purchasing essentials seem easy and affordable.
The global plastic pollution crisis presents significant challenges and impacts, requiring innovative solutions.
Plastic pollution has become one of the most pressing issues of our time, affecting ecosystems, wildlife, and human health in profound ways. This crisis has intensified over the past few decades, largely due to the widespread use of single-use plastics and inadequate waste management systems around the globe.
Rainforest action network banking on climate change
The Rainforest Action Network (RAN), a non-profit organisation, focuses on exposing and addressing the impact of major banks on environmental issues. By conducting in-depth research, RAN reveals how financial institutions continue to support fossil fuel industries, contributing to worsening global warming.
Five tips to #shutupandact to make your business more sustainable
COP27began this week in Sharm El Sheikh, Egypt. This time the tag line is “Together for Implementation” which is aiming to highlight the importance of moving from negotiating to implementing the initiatives that have not been actioned following previous COPs, as well as shining a spotlight on developing nations who are navigating the adaptation to the reality of climate change.
US low carbon business action: sustainable solutions
In the US, businesses are increasingly recognising the importance of reducing their environmental impact. Many are prioritising efforts to lower their carbon emissions, driven by a combination of federal initiatives and market demand. This transition towards low-carbon strategies is vital for addressing global warming and enhancing operational efficiency.
Taking a closer look at carbon offsetting criticisms
In August, John Oliver, the Emmy-winning satirist and host of HBO’s Last Week Tonight, said carbon offsetting is a waste of time and money, and may actually be detrimental to the environment.
Understanding the impending crisis of ecosystem collapse
The world stands on the precipice of an unprecedented environmental crisis, characterised by the looming threat of ecosystem collapse. This situation is not just an isolated issue; it encompasses a multitude of interconnected challenges that impact biodiversity, climate stability, and overall human survival. As various geopolitical tensions rise and economic instability looms, the urgency to confront these environmental challenges becomes paramount.
How businesses can prepare for 2024 EU environmental Laws and Regulations
Did you know the European Union's new directive could change global trade? It sets tough environmental standards. These rules aim to tackle carbon emissions, water quality, and biodiversity. They also affect businesses inside and outside the EU.
If you're a farmer or involved in agriculture, dealing with slurry is probably part and parcel of your work life. But have you ever stopped to think about the environmental impact?
Making your home energy efficient for this fall and into winter
Energy efficiency in homes refers to the effective utilization of energy resources to minimize wastage and reduce costs. This involves using less energy to achieve the same level of comfort or functionality, which not only saves money but also helps protect the environment by reducing greenhouse gas emissions.
The future of energy will involve adapting power grids for artificial intelligence demands
The energy landscape has undergone significant transformations over the past few decades, with the rapid adoption of technology driving unprecedented changes in power consumption and distribution.
When it comes to climate change, the acts of the queen spoke louder than her words
The Queen was a natural leader who was very passionate about protecting the environment, even though other members of her family received greater public recognition for their environmental activism.
The evolution of energy-efficient clothes dryers: a leap towards sustainability
The urge to enhance energy efficiency has catalysed significant advancements in household appliances, with clothes dryers now at the forefront of this transformation.
As energy costs continue to rise and awareness of environmental issues deepens, the quest for innovative and efficient ways to dry clothes has become not only a matter of convenience but a necessity for modern living.
This article delves into the remarkable journey of energy-efficient clothes dryers, highlighting their development, significance, and the positive impact they have on households and the environment.
Are you curious about the health of our planet's protective shield, the ozone layer? It's a crucial part of Earth’s atmosphere that shields us from harmful ultraviolet radiation.
Soil health is a critical component of our ecosystem, playing an essential role in food production, water purification, and climate regulation. It serves as the foundation for plant growth and supports all terrestrial life forms by providing vital nutrients.
The enduring legacy of Appalachian woodland botanicals: A natural treasure trove
The temperate forests of the Appalachian Mountains, one of North America's most biodiverse regions, have long been a source of sustenance and medicinal resources for both indigenous tribes and settlers. These lush forests, rich with understory herbs and forest foods, exemplify the intricate biodiversity that characterises the region. Over millennia, the natural resources found within these woodlands have played a vital role in the lives of the peoples residing in Southwest Virginia and the broader Appalachian area. As society's understanding of health and wellness has evolved, the significance of these plants has gained renewed attention, revealing the complex relationship between humans and their environment.
Vanquish partnership offers car enthusiasts a one-stop shop to offsetting vehicle emissions
Two Auckland-based tech companies, Vanquish and CarbonClick, have come together to deliver a climate-positive solution that takes the sting out of the emissions from what some perceive as a “guilty pleasure.”
Saudi Arabian Airlines (Saudia) offsets 100% of unavoidable scope 1 carbon emissions relating to their full schedule of flights to London Heathrow (LHR) from Saudi Arabia
As the official airline partner of the ABB FIA formula e world championship, all Saudia flights from the kingdom to London over the 2022 sabic London e-prix race weekend had 100% of their unavoidable emissions related to fuel use offset via gold standard credits
Carbon neutrality and offsetting for sports events, venues and organisations
We’ll discuss the environmental toll of sports participation and events, and provide examples of organisations already making strides toward carbon neutrality to inspire your own efforts in this direction.
For the first time, wind power beats coal and nuclear power generation for a day in a new record.
The achievement demonstrated both the progress made in renewable energy and the distance that the US still needs to go in order to meet its climate objectives.
The growth of the voluntary carbon market inspires new Crypto solutions.
Voluntary carbon market volume and value are expected to expand at a rate never before seen by 2022. However, as the need for high-quality carbon offsets grows, supply is becoming more constrained due to systemic restrictions.
Climate Friendly Cart by CarbonClick now available on SAP® store
By integrating with SAP Commerce Cloud solution, Climate Friendly Cart delivers a high-integrity, climate-friendly shopping experience at point of sale
CarbonClick's CEO, Dave Rouse, a panelist at global leaders innovation summit London tech week
Enviro-tech company CarbonClick has been chosen as a New Zealand delegate to London Tech Week. CEO Dave Rouse will speak at the ‘Global Leaders Innovation Summit’, being held on Monday 13 June as part of London Tech Week.
CarbonClick and Locomote partner up to power sustainable business travel
New Zealand based enviro-tech company CarbonClick has partnered with corporate travel marketplace Locomote to provide a new way for businesses to manage their sustainability when travelling for work.
Saudi Arabian Airlines (Saudia) operates the world's longest net-positive flight, powered by CarbonClick
Jeddah, Saudi Arabia: Saudia, the national flag carrier of the Kingdom of Saudi Arabia, today launched the world’s longest net positive flight thanks to a partnership with enviro-tech business CarbonClick and aviation consultancy SimpliFlying.
‘Sustainability in the air’ creating a net-zero future for aviation
Enviro-tech company CarbonClick has stepped up its mission to fight against climate change with its sponsorship of the podcast series ‘Sustainability in the Air’ hosted by SimpliFlying, the world’s leading aviation consulting firm.
Happy Earth day. Now’s the time to invest in our planet.
Since 1970, more than a billion people around the world have marked April 22 as a time to pause and take stock of their impact on the planet and participate in some form of positive action to cool the pace of climate change and promote positive environmental practices.
More than ever, consumerism is rife in every part of the world, especially in first-world countries. Under capitalism, we’re all buying products we don’t need, only because they offer a sense of acceptance from, and belonging with, the people around us.
CarbonClick is pleased to announce it has achieved certification as a B Corp enterprise recognising its high standards for accountability, transparency, social sustainability and environmental performance.
The role of technology in creating a greener future
Our CEO, Dave Rouse, was one of two featured speakers to present at London Tech Week’s leadership roundtable panel on ‘the role of technology in creating a greener future’.
The difficult transition of fossil fuel oil and gas companies to clean energy
The world’s largest producers of carbon dioxide are trying to get off dirty power by investing heavily in renewables like wind, solar and hydroelectricity – but they’re running into some big hurdles.
Understanding the environmental impact of lockdown — is remote working a big step toward lowering our carbon footprint?
The combined forces of New Zealand’s clean green reputation and being listed high on the “Covid-19 Resilience Ranking”, suggest we are at risk of taking a ‘business as usual’ approach to both.
Carbon emissions from the aviation sector have been a highly popular subject recently, despite the fact that most of us don’t give it much thought. This is mostly due to the increased focus on issues of sustainability and climate change.
Climate change, city living and our carbon footprint
It might not feel like it right now as we’re still currently going through a global pandemic but climate change is the biggest emergency we have ever faced.
Sustainability efforts by Amazon – why they are significant
Sustainability brands are doing a good job contributing to the environmental movement, and whether you like Jeff Bezos and Amazon or not, Amazon is now one of the most progressive sustainability brands.
My take on COPOUT26: some progress has been made, but we are still on a catastrophic trajectory
As a New Zealand business delegate at COP26, I’ve met and worked with some amazing people during the event. Behind the scenes, it’s been truly inspirational to see the efforts that have gone in, the negotiations that ran into the early hours of the morning and what people are doing in their own ways to help change the catastrophic trajectory we are on.
Climate change is the greatest challenge of today. Businesses, Governments, and individuals are all scrambling to play, or appear to be playing, their part. The carbon offset market will play an important role in rapid decarbonisation over the coming decade and is expected to grow 15-fold to $50bn by 2030.
CarbonClick’s CEO, Dave Rouse, gives a summary of all the crucial information you need to know about the latest Intergovernmental Panel on Climate Change (IPCC) report – what it is, what it means for you and the solutions that it presents.
Every business can cut their carbon footprint and contribute to environmental conservation. We’ve compiled this top 10 checklist full of easy steps any business can take, including yours, to help reduce the carbon footprint. Many of these are actually about optimizing your electricity use, so you can also save money! Implementing a few of these will save your wallet and the Earth.
Am I supporting high-quality carbon offset projects?
The voluntary carbon market, which allows consumers to buy, sell, and trade carbon credits produced through carbon offset projects in order to compensate for individual, corporate, or global greenhouse gas (GHG) emissions has grown so much in 2021 that the international Taskforce on Scaling Voluntary Carbon Markets (TSVCM) estimates a 15-fold increase in demand for offsets by 2030.
The science behind climate change and what we can do to help out
Our global environment and climate is under threat, but we have the power to turn the tide. We can best address this issue through deeper understanding and appropriate action. This article will cover what you need to know about climate change.
Carbon emissions footprint broken down by mode of transport
This article will walk through some common methods used to estimate an individual’s or organisation’s carbon footprint, then break down those numbers into categories based on the type of travel they take. This way, you’ll be able to see where to make changes in order to lower your overall emissions.
Jan is a Senior Business Analyst with over 10 years experience identifying and delivering the right solution for the customer and business. He was one of the guys behind Air New Zealand’s carbon offsetting technology.
Can companies align their political activities with their sustainability work?
Carbon offsets are often used to get companies in compliance with environmental regulations, but how can they be reconciled with the political activities of a company? This is an issue that many sustainability managers have been grappling with for years – but there’s a solution. In this article, we will explore carbon neutrality and climate change to answer this question.
Why carbon offsets are necessary until we scale back our emissions
There’s no denying CO2 emissions are a huge problem as it stands. They’re causing the Earth’s climate to change in ways that make it difficult for life as we know it to continue, and they’re also impacting our air quality.
Paul’s favourite Kiwi roadtrip. From CarbonClick’s outset, Paul has been the driving force behind CarbonClick’s technology. A trailblazer in Air New Zealand’s digital transformation, Paul built the foundations of Air New Zealand’s API development standards and practices.
Michelle’s favourite Kiwi roadtrip. Michelle Noordermeer is the COO of CarbonClick. She has worked in the aviation industry for over 20 years, initially starting out as a flying instructor, and moving onto analytical, project management, business development and strategic roles.
Roadtrip #1: Back roads of the central north island
Dave Rouse is the CEO of CarbonClick. He is a Kiwi born entrepreneur who grew up in between the bush in the Waitakeres and working on organic farms. Dave’s connection to the land has seen him bring a unique set of sustainability values into a variety of businesses.
Climate change is already well and truly causing extreme weather events around the world and fluctuating temperatures. For these very reasons alone, it’s vital that we unite, as a global population, to create a sustainable future.
Everyone has a responsibility to contribute towards a sustainable future. The world is shifting away from fossil fuels and working together to reduce harmful greenhouse emissions to combat climate change. This is everyone’s job, and there are many simple things you can do to reduce your carbon footprint closer to zero.
Is the circular economy the answer to achieving net-zero?
Fighting man-made climate change has become a major issue in the current environment, with scientific research predicting catastrophic weather events in the future if we don’t act now.
The world is changing and it is important that your business adapts. Consumers favour brands that are environmentally conscious, as the world moves towards a carbon net-zero future in a bid to halt and reverse man-made climate change.
Moving to carbon neutrality: the role of offsets for your organisation
Working towards a more sustainable future for our planet is one of the key issues facing society. To do this, we need to become more carbon-neutral. This means reaching a point by 2050 where the amount of CO2 being absorbed by the Earth by trees and plants is equal to or greater than the volume of emissions being produced.
Unfortunately, it is not viable to put large-scale solar PV systems or wind turbines onto aeroplanes… yet. So as the world heads towards a carbon net-zero future, what can airlines do to ensure that they are contributing towards this goal?
The rise of corporate carbon neutrality: what it means for your business
Humanity is rapidly moving towards a more sustainable future as we look to combat man-made emissions and climate change that jeopardise the environment.
Understanding the language around net-zero, carbon neutrality and climate justice
As we work towards a more eco-friendly future, there are various terms and phrases we collectively need to learn in order to fully understand what we are doing.
Our insights: consumer attitudes to sustainability
Our insights show that consumers are increasingly concerned by climate change and that they want to be engaging with business who show they care about the planet.
The benefits of making your business carbon neutral
Reducing emissions and your carbon footprint in business means more than just a warm fuzzy feeling that you get knowing that you are doing your part to save the environment and fight climate change. And the best part is, you’re doing just as much good for your business during the process.
How to meet customer needs in building a sustainable e-commerce brand
Climate change is a growing concern amongst consumers. As they continue to look for ways to shop sustainably, green e-commerce solutions are fast becoming vital to the survival of businesses and, crucially, the planet.
Unlocking the potential of carbon credits: a voluntary approach to a greener future
The fight against climate change is an arduous journey that requires collective action from every sector. In particular, companies are increasingly recognising their responsibility and potential to catalyse significant change.
How do carbon offsets fit in with a sustainability strategy?
We’re all on a sustainability journey, whether you’re an individual or representing a business. And mostly, we’re in the passenger seat. But there are always things we can do, directions we can give, to influence where we’re headed.
Sustainability is no longer a luxury for businesses. Here’s what you need to know. What’s changing, who’s doing it, why it’s worth doing and how to get started.
Blue Carbon is the name of the carbon stored naturally by marine and coastal ecosystems. There are three types of coastal ecosystems — mangroves, seagrasses, and tidal marshes — which are responsible for storing over 50% of all the world’s blue carbon.
Carbon neutrality: what it means and how your business can get there
Consumers are becoming increasingly sensitive to climate change and are starting to look at the environmental impact of their consumption. As a response to this, we’re seeing the words ‘carbon neutral’ pop up on product descriptions and marketing campaigns.
When it comes to climate change, the science is clear. According to the Intergovernmental Panel on Climate Change, the only way to avoid the worst consequences of climate change is to become a carbon neutral world.
Five ways companies can improve their sustainability initiatives
Sustainability is a crucial thing to focus on if you want to improve your company’s brand, reputation and overall climate change resilience. But creating the right sustainability initiatives and implementing them within your business can be challenging as one size does not fit all.
It was once universally understood that institutional investors’ main objective, and the investee company’s main obligation, was to maximise short term returns for shareholders, without regard for other factors like social and environmental impacts.
Electric Vehicles (EVs) have been a popular discussion topic in the movement towards a more sustainable future. Although many think that EVs are one of the most impactful solutions to reducing our carbon footprint, there are a few important considerations when purchasing one.